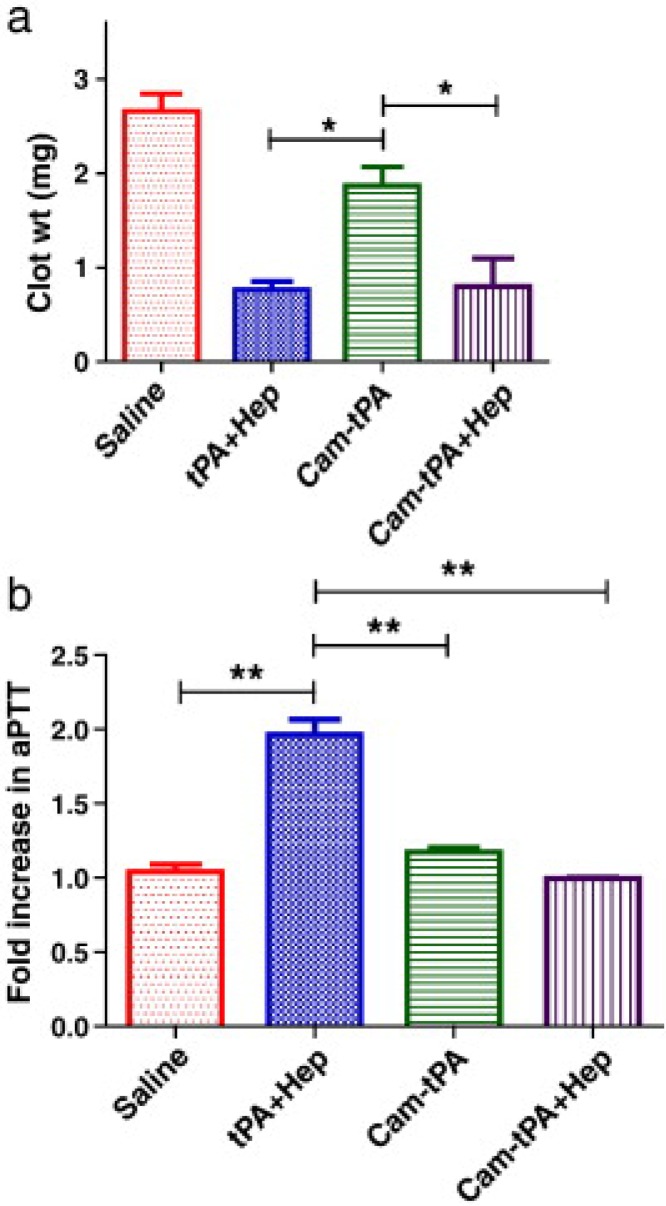
Fig 6.
In vivo clot lysis in rat jugular-vein thrombosis model. (a) Extent of clot lysis after administration of tPA and heparin combination (tPA-Hep), camouflaged tPA and camouflaged tPA plus heparin. (b) Fold increase in aPTT 1 h after the treatment compared to the value measured before the intervention. Data represent mean ± SD, n = 3, *p < 0.05,**p < 0.01. Reproduced with permission from 25

