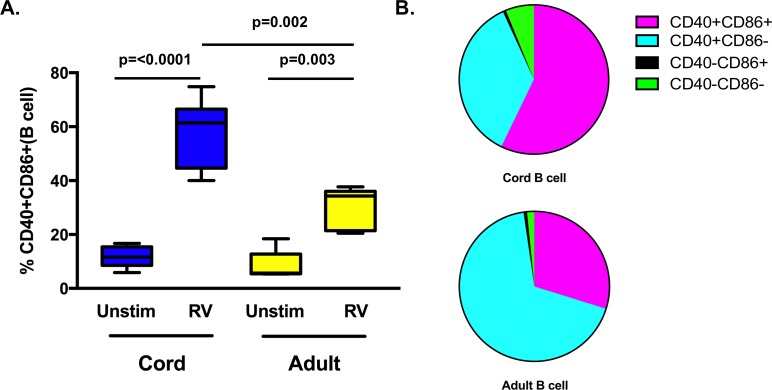
Fig 6. B cell responses after RV stimulation.
A. Box-and-whisker plot of frequency of double positive (CD40+CD86+) B cells after 24 hours exposure to RV or unstimulated (Unstim). B. Parts of whole graph of varied phenotypes on right. Cord n = 7; Adult n = 5. Significant p values are shown in the graph, unstimulated comparisons between adult and cord samples were not significant.

