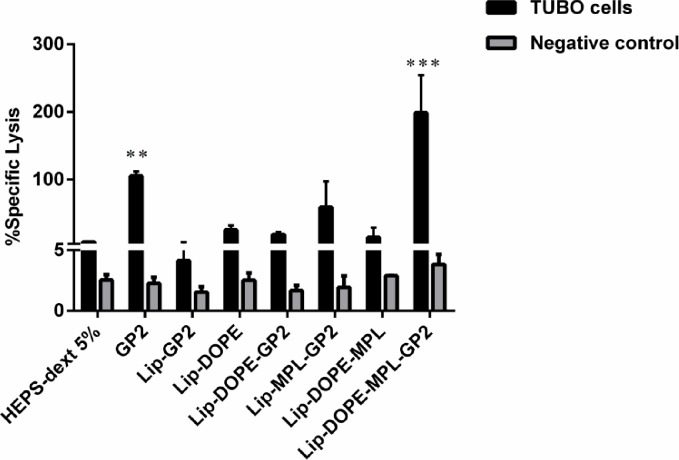
Fig 4. In vitro antigen-specific CTL response in different formulations for splenocytes isolated from vaccinated mice.
CTL response was assessed by Calcein AM-loadedrHER2/neu-expressing TUBO cells and rHER2/neu negative CT26 cells, Data are shown as mean ± SEM (n = 3). **p<0.01, and ***p<0.001; denote significant difference from the HEPS-dextrose 5%.

