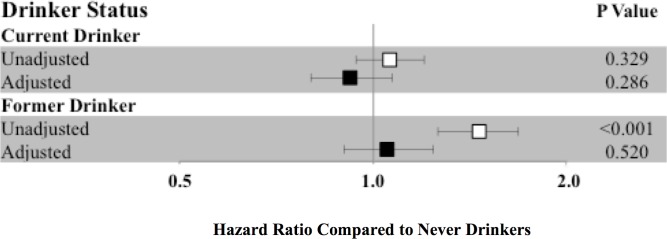
Fig 3. Hazard ratios for incident atrial fibrillation according to drinker status with never drinkers as the reference group.
Hazard ratios are shown unadjusted (white square) and adjusted (black square) for study site, age, sex, race, body mass index, smoking status, cigarette years, hypertension, diabetes mellitus, coronary artery disease, and heart failure. Y error bars denote 95% confidence intervals.

