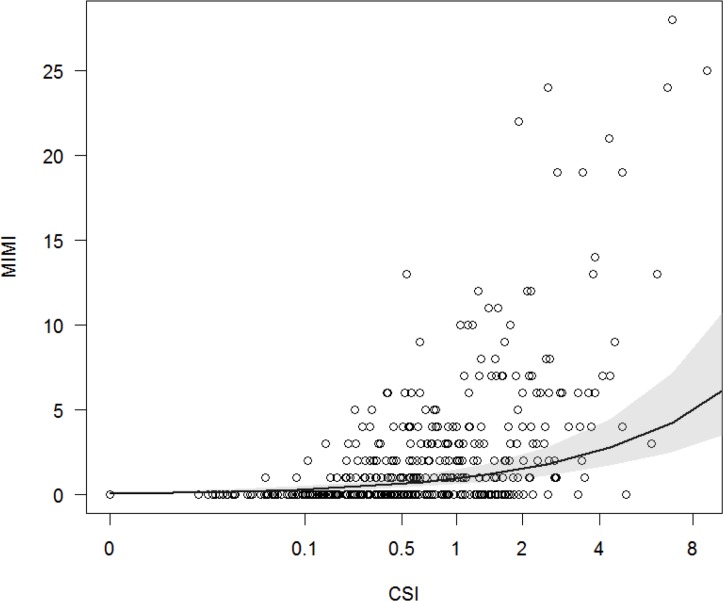
Fig 2. The occurrence of male-infant-male interactions (MIMIs) as a function of relationship strength (CSI).
The CSI and the frequency of MIMIs were calculated for each dyad in each observation period. The black line depicts the relationship between CSI and MIMI as predicted by Model 3. The circles represent the raw data of 407 dyads and the grey area the 95% confidence interval of the model. The x-axis is plotted on a double square root scale (^0.25).

