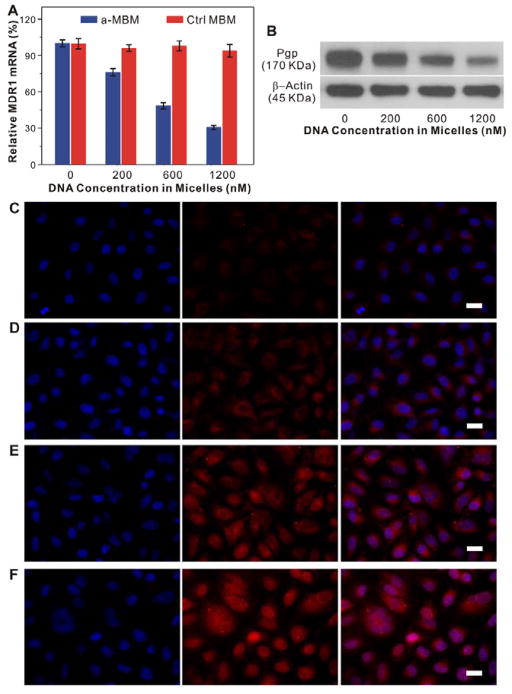
Figure 4.
Anti-MDR1 effects of a-MBMs in OVCAR8/ADR cells. (A) qRT-PCR analyses of MDR1 mRNA transcription in the OVCAR8/ADR cells treated with different concentrations of a-MBMs (blue) and ctrl-MBMs (red). Each bar presents the mean and standard deviation derived from three independent experiments. (B) Western blot analyses of Pgp expression in the OVCAR8/ADR cells after treatment with a-MBMs at different concentrations, which was probed with anti-Pgp antibody and anti-β-actin antibody, respectively. Fluorescence images of OVCAR/ADR cells treated with free DOXs (C), ctrl-MBM-DOXs of 1,200 nM (D), a-MBM-DOXs of 200 nM (E) and 1,200 nM (F). Scale bar: 20μm.

