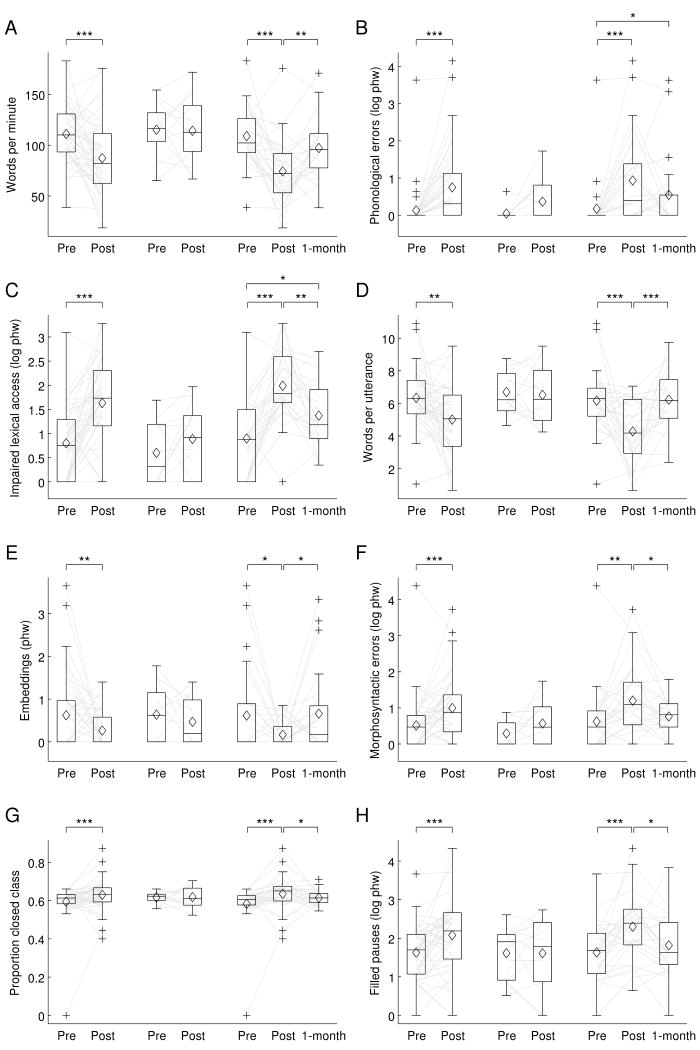
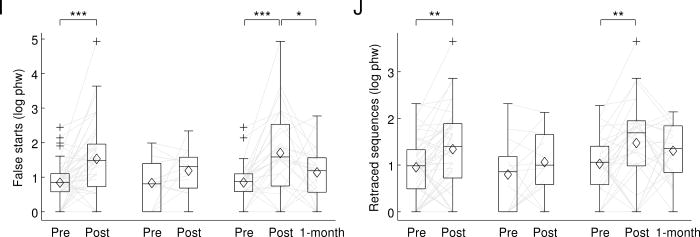
Figure 2.
Connected speech measures. In each plot, the first pair of boxes show pre-surgical and 2-3 days post-surgical measures for all 43 patients. The next pair of boxes show pre- and post-surgical measures for only the 14 patients who did not meet WAB criteria for aphasia at 2-3 days post-surgery. The final three boxes show pre- and post-surgical measures for the 29 patients who presented with aphasia at 2-3 days post surgery, and 1-month follow-up measures for 24 of these patients. (A) Words per minute. (B) Phonological errors (log phw). (C) Impaired lexical access (log phw). (D) Words per utterance. (E) Embedded clauses (phw). (F) Morphosyntactic errors (log phw). (G) Proportion closed class. (H) Filled pauses (log phw). (I) False starts (log phw). (J) Retraced sequences (log phw). phw = per hundred words; boxes = inter-quartile range; whiskers = the range not including outliers; pluses = outliers; horizontal lines = medians; diamonds = means; light gray lines = trajectories of each patient. * = q ≤ 0.05 (corrected for false discovery rate); ** = q ≤ 0.01 (corrected for false discovery rate); *** = q ≤ 0.001 (corrected for false discovery rate).


