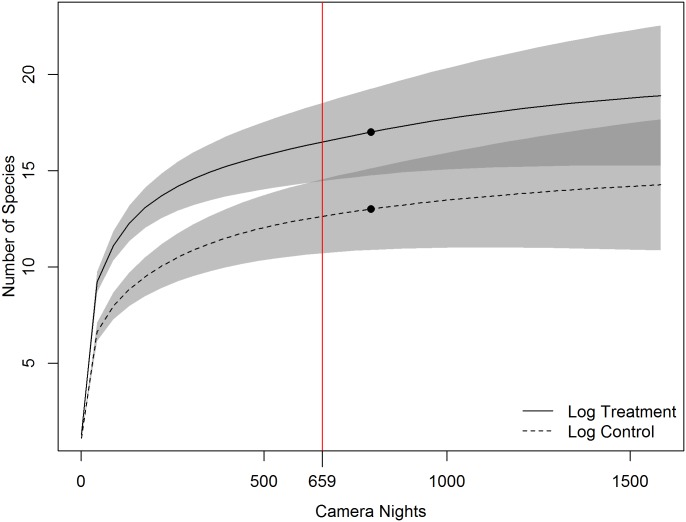
Fig 1. Sample-based species accumulation curve from 30 paired cameras, run for an average of 25.4 camera nights, with one camera in each pair oriented toward a log feature, and the other at a nearby (mean = 15.1 m) random location.
Shaded areas represent the 95% confidence intervals, with darker shaded areas representing confidence interval overlap between the two scenarios. Black dots indicate the actual sampling effort of this study. The vertical line with label indicates the point at which the confidence intervals of the feature and control groups overlap.

