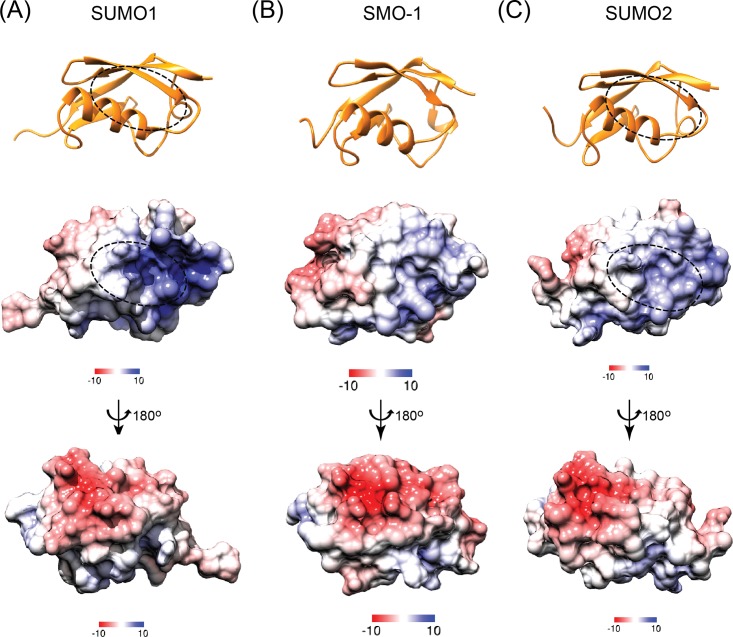
Fig 3. Comparison of structures and electrostatic surface potential between SMO-1 and its SUMO homologues.
(A), (B) and (C) The top panel shows the cartoon representation of SUMO1, SMO-1 and SUMO2 (all in orange). The SIM interacting region of SUMO1 and SUMO2 is marked by an oval in broken line. The middle panel shows the APBS calculated (at 298 K) electrostatic surface potential of respective proteins in the orientation shown in top panel. The bottom panel shows the same electrostatic surface potential at an orientation rotated 180 degree about the vertical shown as shown. Color gradient scheme of the electrostatic surface is shown for each surface. Positively charged surfaces are colored blue, neutral surfaces are in white and negatively charged surfaces are in red. The unit of the color gradient shown is kcal/(mol.e).

