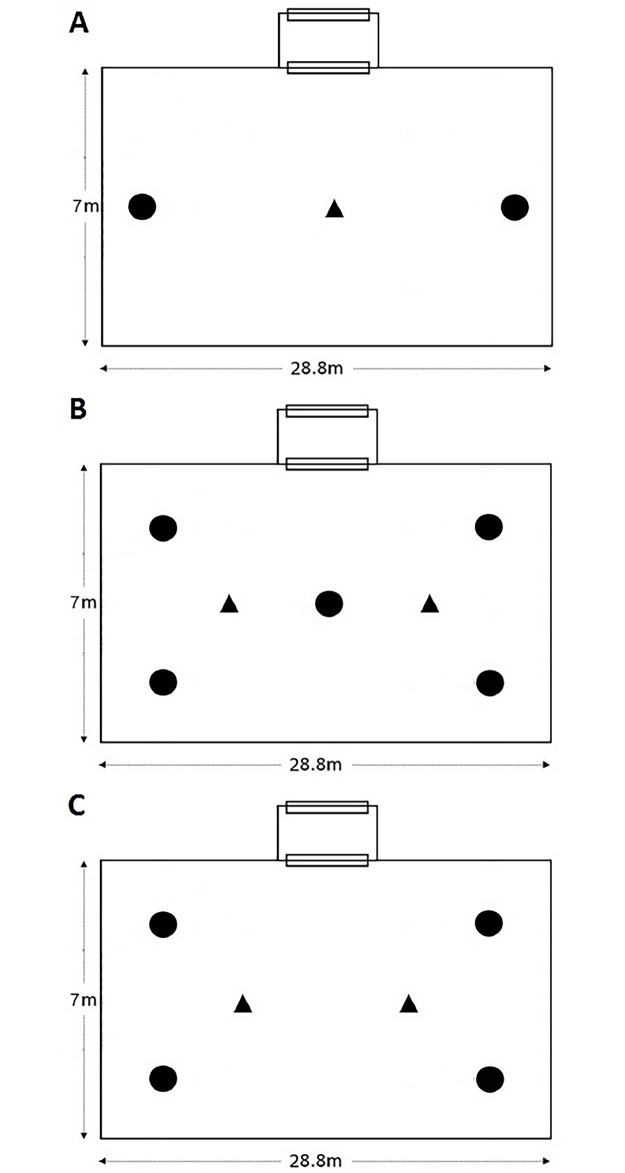
Fig 3. Schematic diagram of the trap positions and mosquito release points within the semi-field system.
Set ups for experiments 1, 2 and 3, are shown in figure panels A, B and C, respectively. Trap positions are shown in circles, and mosquito release points in triangles. In all experiments, the treatment being tested was rotated between the test locations nightly.

