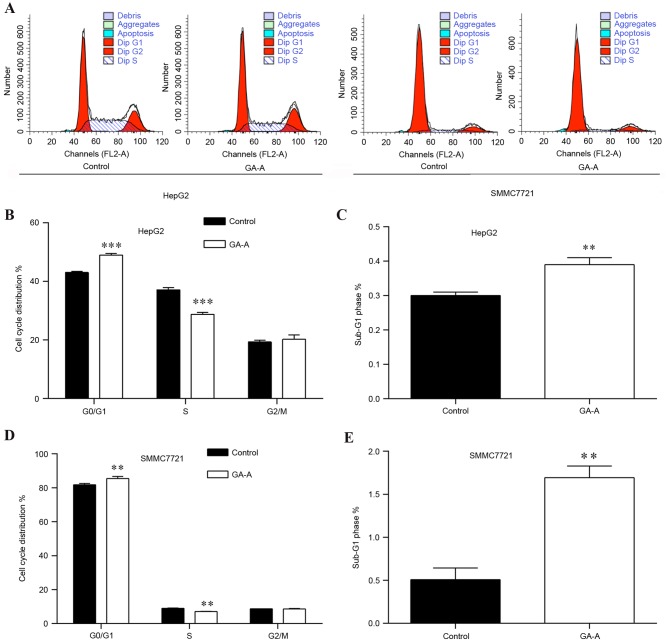
Figure 2.
Effect of GA-A on cell cycle distribution of HepG2 and SMMC7721 cells. (A) Flow cytometry analysis of HepG2 and SMMC7721 cells induced by 100 and 75 µmol/l GA-A, respectively for 48 h. Comparison of HepG2 cells in (B) G0/G1, S, G2/M phases and (C) sub-G1 phase between the control and treatment groups. Comparison of SMMC7721 cells in (D) G0/G1, S, G2/M phases and (E) sub-G1 phase between the control and treatment groups. Data are expressed as the mean ± standard deviation. *P<0.05, **P<0.01 and ***P<0.001 vs. control. GA-A, ganoderic acid A.

