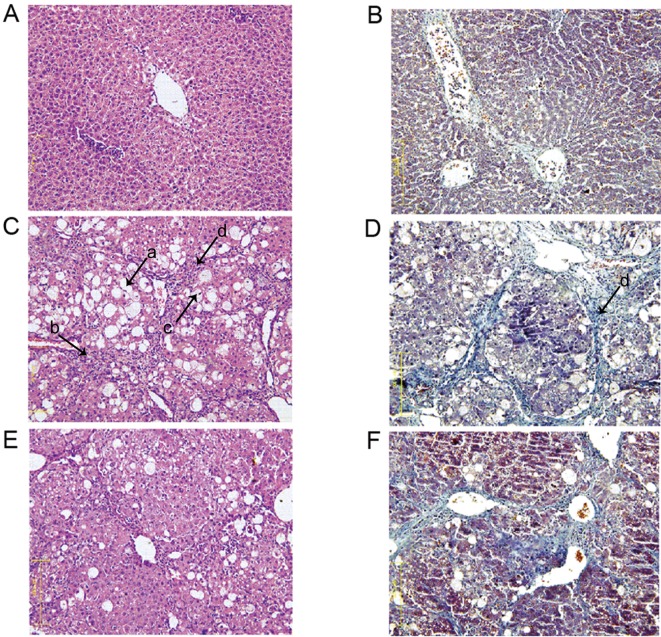
Figure 1.
Histological examination of carbon tetrachloride-induced liver fibrosis in rats at 12 weeks. Magnification, ×200. (A) HE and (B) Masson staining of liver tissue from the control group. (C) HE and (D) Masson staining of liver tissue from the model group. (E) HE and (F) Masson staining of liver tissue from the SGJPF group. Arrows: a, increased fatty degeneration; b, inflammatory cell infiltration; c, a dissolved nucleus; d, increased hyperplastic collagen fibers. HE, hematoxylin and eosin; SGJPF, Shu Gan Jian Pi formula.

