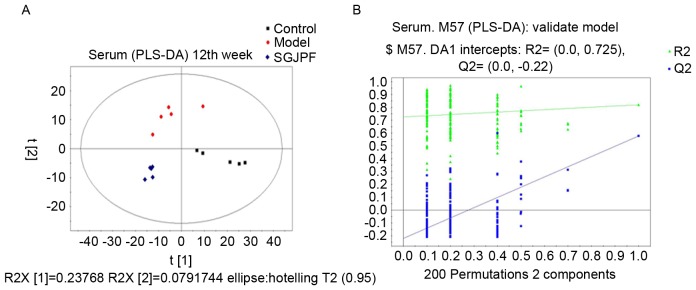
Figure 4.
PLS-DA model score plot and permutation test plot. (A) Score plot and (B) plot of the permutation test (200 times) of the PLS-DA model obtained from the control, model and SGJPF groups. A total of 200 permutations were performed and plotted according to the resulting R2 and Q2 values. Green triangle, R2; blue square, Q2. R2=0.725 and Q2=−0.22. PLS-DA, partial least squares-discriminate analysis; SGJPF, Shu Gan Jian Pi formula.

