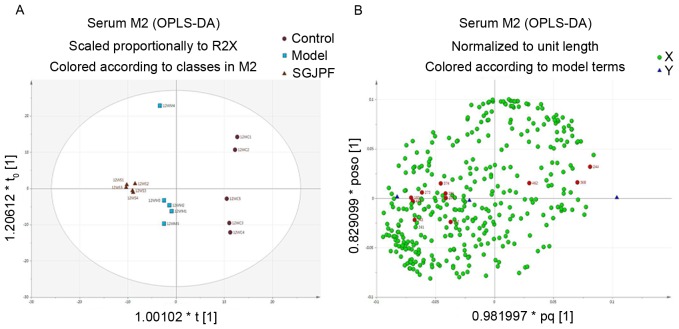
Figure 5.
OPLS-DA analysis. (A) OPLS-DA score plot and (B) loading plot of rat serum samples obtained from the control, model and SGJPF groups. Each dot in the loading plot represents a metabolite that was identified as one of the most influential variables according to their respective contributions to the discrimination, red dots indicate potential biomarkers. OPLS-DA, orthogonal projections to latent structures-discriminate analysis; SGJPF, Shu Gan Jian Pi formula.

