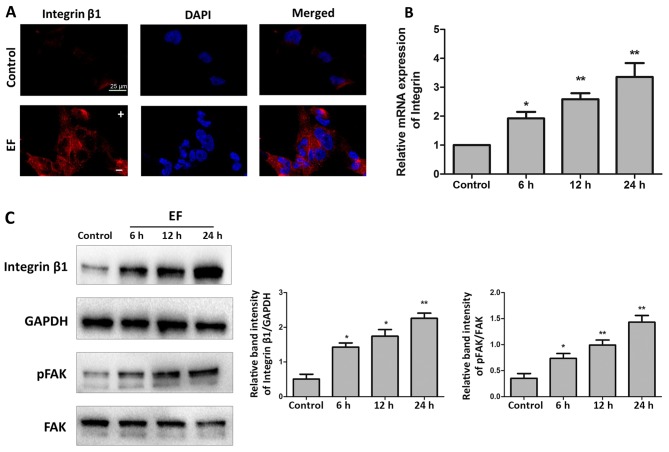
Figure 3.
EF exposure activates integrin β1/FAK signaling. (A) Immunofluorescent staining for integrin β1 (red) in control group and EF-treated group for 24 h. Nuclei were counterstained with DAPI (blue). Scale bar, 25 µm. (B) Reverse transcription-quantitative polymerase chain reaction analysis of integrin β1 mRNA expression levels following 6, 12, and 24 h EF exposure. (C) Western blot analysis for the protein expression levels of integrin β1, pFAK and total FAK following 6, 12, and 24 h EF exposure. Data were presented as mean + standard deviation. *P<0.05 and **P<0.01 vs. control. EF, electric field; FAK, focal adhesion kinase; p, phosphorylated; -, cathode; +, anode.

