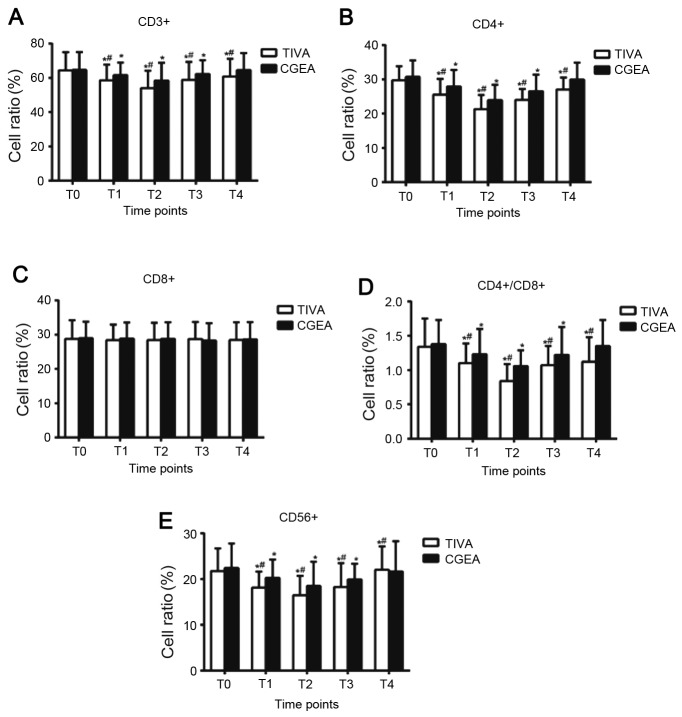
Figure 1.
Cell ratios of (A) CD3+, (B) CD4+, (C) CD8+, (D) CD4+/CD8+ and (E) CD56+ of NSCLC patients in the CGEA and TIVA groups before and after surgery. *P<0.05 vs. T0 in the same group; #P<0.05 vs. CGEA group at the same time. CD, cluster of differentiation; TIVA, total intravenous anesthesia; CGEA, combined general-epidural anesthesia; T0, before anesthesia; T1, at the end of surgery; T2, 24 h after surgery; T3, 48 h after surgery; T4, 72 h after surgery.

