
Figure 6.
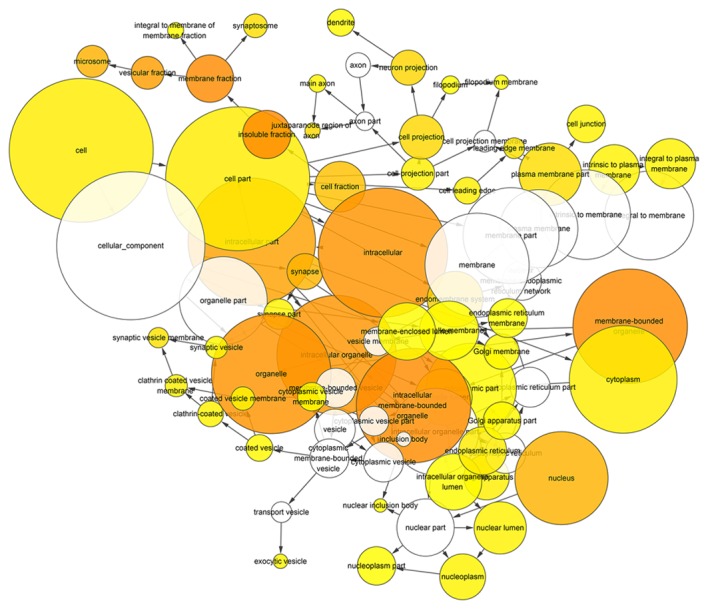
Hierarchical Network in BINGO analysis of predicted target genes of miR-136-5p of cellular component. Each node represents a biological process. The bigger node means more genes participating in the process. All colored nodes indicate statistical significance (P<0.05). The deeper color indicates the smaller P-value of the biological process. White colored nodes were used to connect the biological processes without statistical significance.