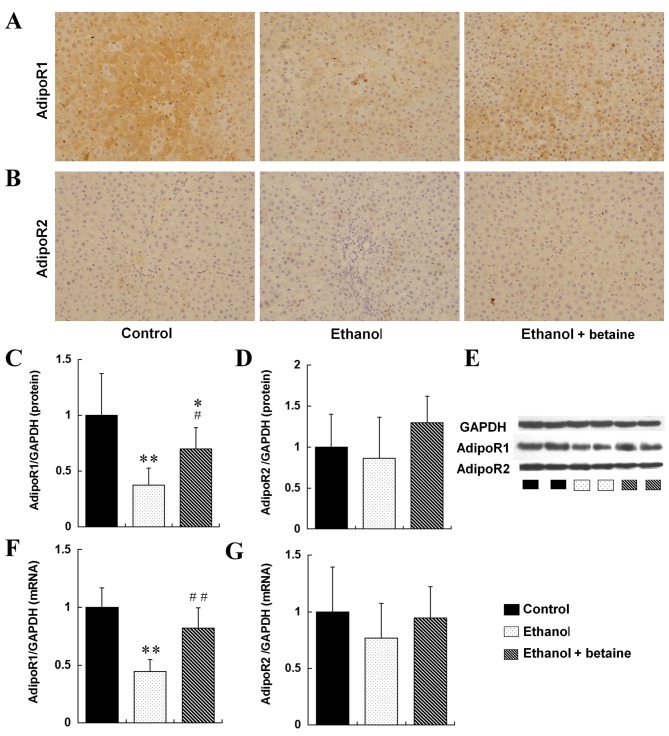
Figure 4.
Expression of AdipoR1 and AdipoR2 in the rat liver. Immunohistochemical staining images of (A) AdipoR1 and (B) AdipoR2 (original magnification, ×400). Quantitative representation of hepatic protein levels of (C) AdipoR1, (D) AdipoR2 and (E) representative image, as detected by western blotting. Hepatic mRNA levels of (F) AdipoR1 and (G) AdipoR2, as detected by reverse transcription-quantitative polymerase chain reaction. **P<0.01, *P<0.05 vs. control group; ##P<0.01, #P<0.05 vs. ethanol group. AdipoR, adiponectin receptor; GAPDH, glyceraldehyde-3-phosphate dehydrogenase.

