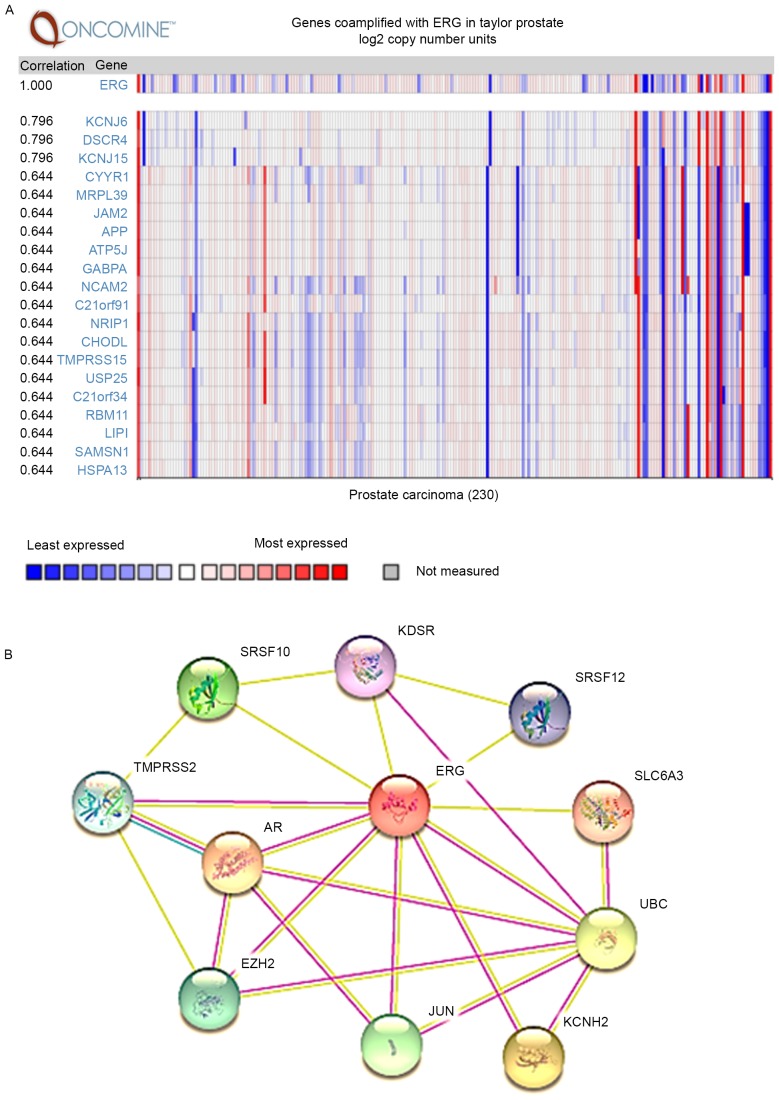
Figure 3.
Co-expression and interaction networks of ERG in prostate cancer. (A) Co-expression analysis of ERG in prostate cancer using Oncomine database. (B) The interaction networks of ERG analyzed by STRING. TMPRSS2, transmembrane protease serine 2; ERG, v-ets erythroblastosis virus E26 oncogene homolog.

