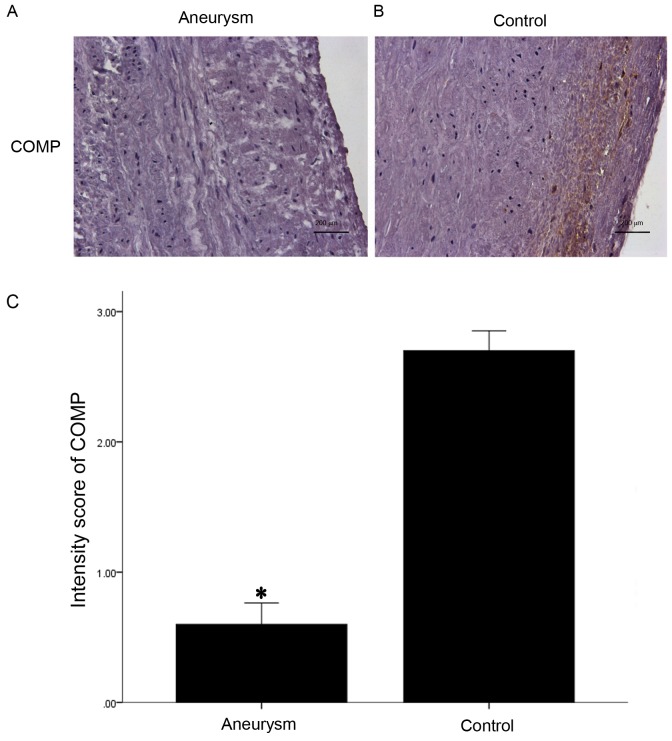
Figure 5.
Protein expression of COMP in the aneurysm aorta. Representative images of COMP protein expression in (A) aneurysm and (B) control samples (magnification, ×400; Scale bars, 200 µm). (C) Quantification of protein COMP expression levels detected via immunohistochemistry. COMP was stained as brown chromogen which was primarily located in the extracellular matrix and along the intima-medial border. Semi-quantitative analysis demonstrated that there was decreased expression of COMP in aneurysm aortas (n=4) when compared with the control aortas (n=6). *P<0.05 vs. control. COMP, cartilage oligomeric matrix protein.

