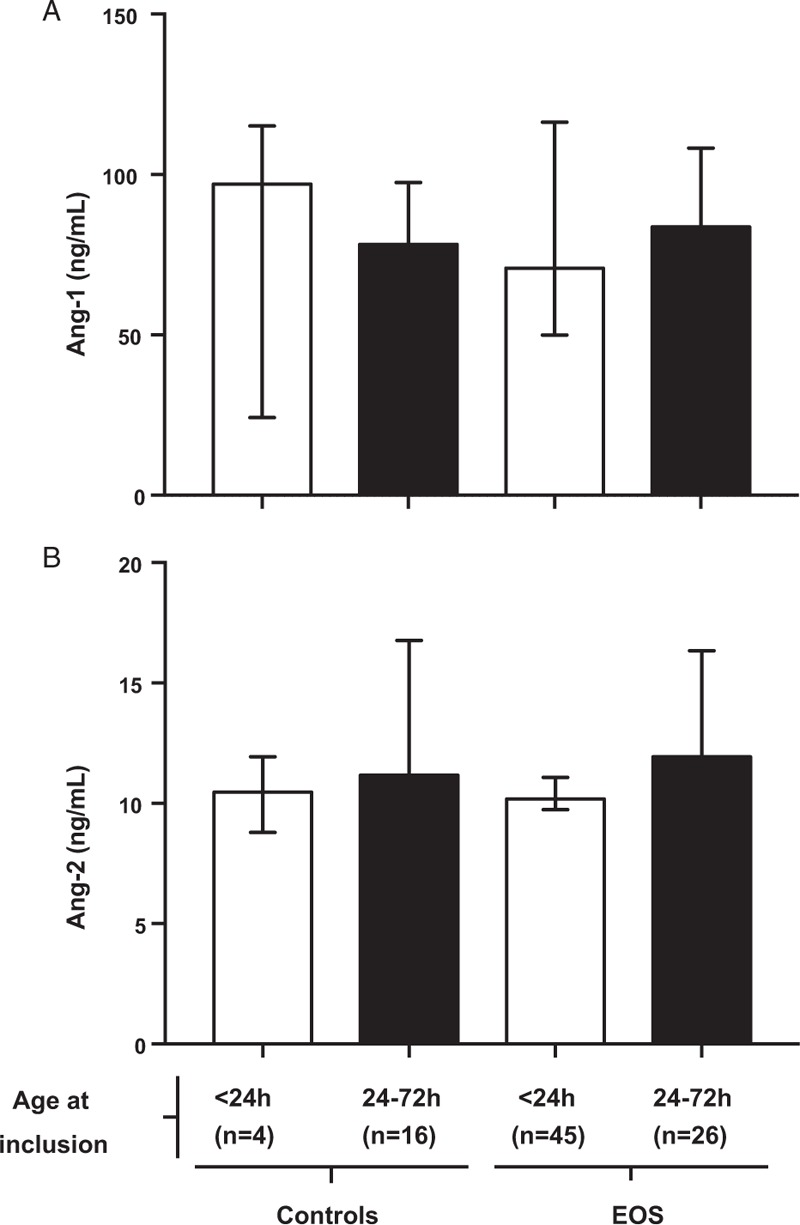
Fig. 2.
Serum levels of Angiopoietin-1 and Angiopoietin-2 at inclusion in newborns included before and after the first 24 h of life.

A, Angiopoietin-1 (Ang-1). B, Angiopoietin-2 (Ang-2). Data represent pooled levels at t = 0 from newborns considered uninfected (controls) and from newborns considered infected (blood culture negative and positive EOS), included before 24 h (white bars) versus 24 to 72 h (black bars) after birth. Data was analyzed with a Mann–Whitney test. Bars represent median values and error bars interquartile range.
