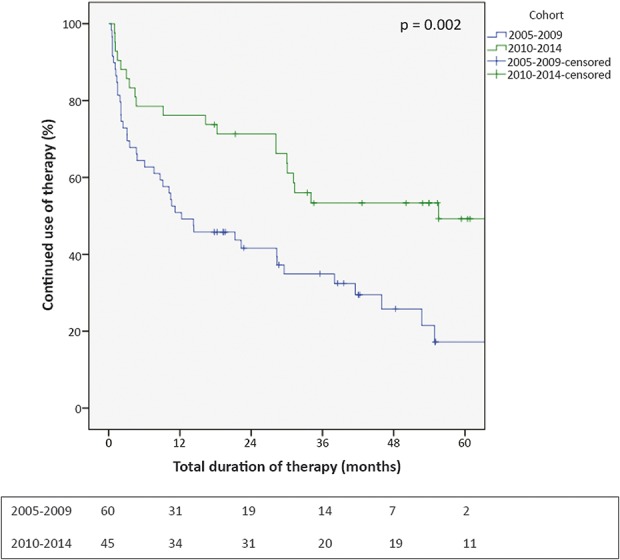
FIGURE 2.

Kaplan–Meier curve of therapy continuation. Kaplan–Meier curve showing the percentage of continued thiopurine users over time. Cases discontinuing therapy for other reasons than intolerable AEs were censored. Absolute numbers of continuing users were depicted under the figure.
