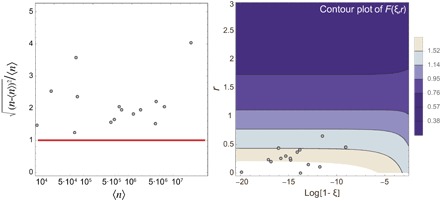
Fig. 5. Tropical forests are poised in the vicinity of criticality.

(A) Plot of the relative fluctuations of species abundances, , in linear scale versus abundances 〈n〉 at the logarithmic scale. The black dots represent the predicted values for each of the 15 tropical forests listed in Table 1 at the whole-forest scale, and the red line is the line of equation y = 1. All values are located above this line, thus indicating that the relative fluctuations in abundance are considerable for all the forests. (B) Contour plot of the relative fluctuation of abundances for an NB SAD . The black dots represent the pair (r, log [1 − ξ]), where r and ξ are the predicted parameters for each forest of our data set after upscaling at the whole-forest scale. These dots are all located in the region of the parameter space around which the function F(ξ, r) diverges, that is, ξ ≈ 1 and 0 < r < 0.7.
