. 2017 Sep 26;6:e27369. doi: 10.7554/eLife.27369

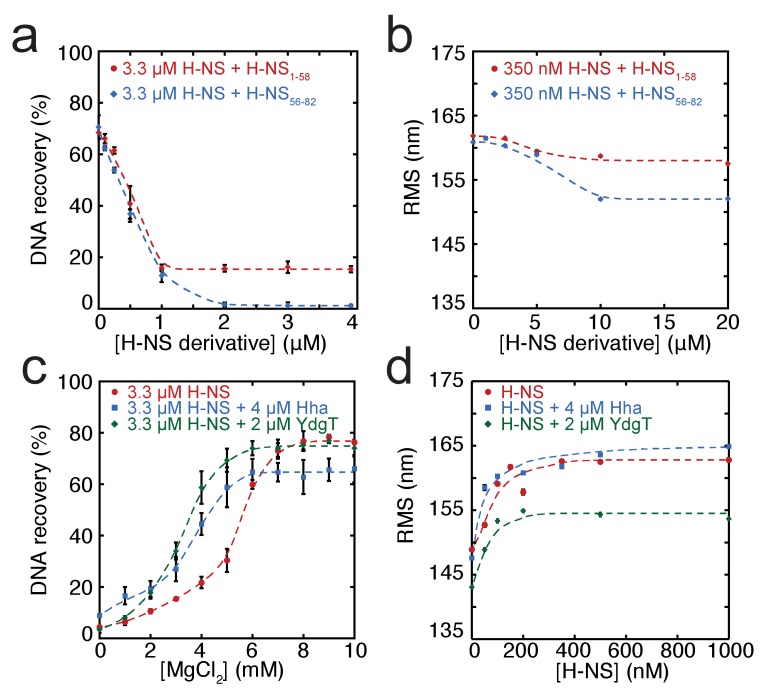
Figure 3. Modulation of H-NS function by protein cofactors.

(a) DNA bridging efficiency as a function of inhibiting peptides targeting either the dimerization domain (H-NS1-58) and multimerization domain (H-NS56-82). (b) Root Mean Square displacement (RMS) as a function of inhibiting peptides targeting either the dimerization (H-NS1-58) and multimerization (H-NS56-82) (N > 70, for each point). (c) DNA bridging efficiency as a function of Mg2+ concentration in the presence and absence of 4 µM Hha or 2 µM YdgT. (d) RMS of DNA in the presence of H-NS, H-NS-Hha, and H-NS-YdgT. Dashed lines are to guide the eye (N > 60, for each point).

Figure 3.

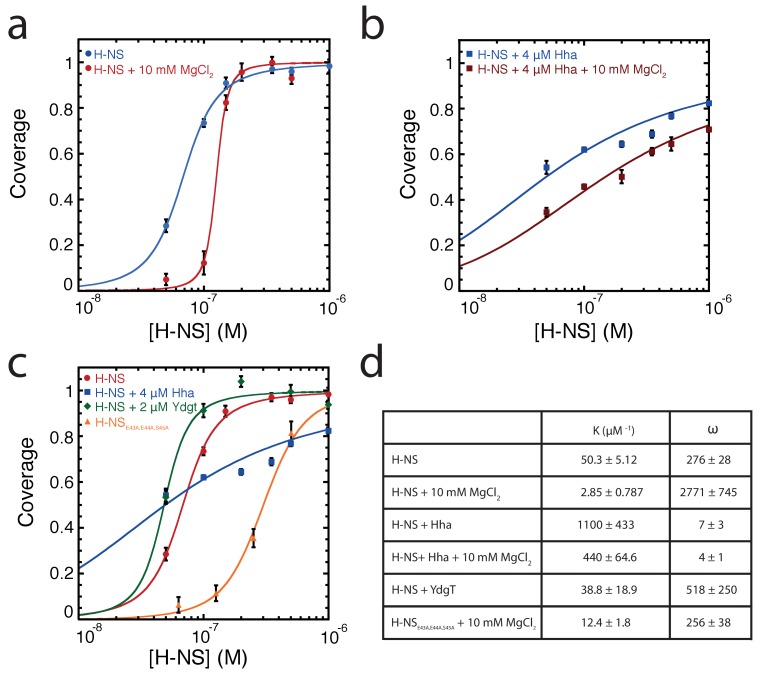
Figure 3—figure supplement 1. McGhee-von Hippel analysis of H-NS DNA binding curves based on TPM data.

Figure 3—figure supplement 1.

Binding curves of (a) H-NS, (b) H-NS + Hha TPM data as a function of Mg2+, and (c) H-NS, H-NS + Hha, H-NS + YdgT, and H-NSE43A,E44A,S45A (d) Fit variables for all datasets, the binding affinity (K), and cooperativity (ω). Fit curves are shown as solid lines.
Figure 3—figure supplement 2. DNA-bridging efficiency of H-NS (red), H-NS + 4 µM YdgT (blue) and H-NSE43A,E44A,S45A (orange) as a function of MgCl2 concentration.

Figure 3—figure supplement 2.