Figure 1.
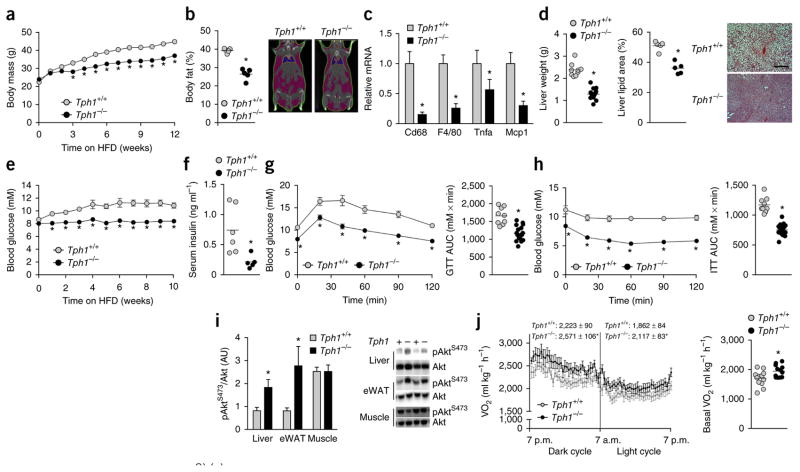
Tph1−/− mice are protected from obesity, chronic low-grade inflammation, NALFD and insulin resistance. (a,b) Body mass (n = 9 Tph1+/+ and n = 19 Tph1−/−) (a) and adiposity (b) of HFD–fed Tph1+/+ and Tph1−/− mice (n = 5 per group). Right (b), representative CT image. (c,d) eWAT inflammatory mRNA (n = 8) (c), liver weights (n = 9 Tph1+/+ and n = 19 Tph1−/−) and liver lipid area of HFD-fed Tph1+/+ and Tph1−/− mice (n = 5 each group) (d). Right (d), representative liver cross-sections stained with H&E; scale bar is 100 μm. (e–h) Fed blood glucose over the course of the diet intervention (n = 9 Tph1+/+ and n = 19 Tph1−/−) (e), fasting serum insulin concentrations (n = 6 Tph1+/+ and n = 5 Tph1−/−) (f) and glucose tolerance test (GTT) (g) and insulin tolerance test (ITT) (h) performed after 10–12 weeks of HFD in Tph1+/+ and Tph1−/− mice (n = 9 Tph1+/+ and n = 19 Tph1−/−). AUC area under the curve. (i) AktS473 phosphorylation relative to total Akt in liver, eWAT and mixed gastrocnemius muscle from Tph1+/+ and Tph1−/− mice killed 15 min following an injection of 0.5 U kg−1 insulin (n = 4 per group). AU, arbitrary units. (j) Oxygen consumption (VO2) during light and dark cycles (left) and in the absence of movement (right) in HFD-fed Tph1+/+ and Tph1−/− mice (n = 12 per group). Data are expressed as means ± s.e.m. *P < 0.05 relative to Tph1+/+ mice as determined using a Student’s t-test or two-way repeated measures analysis of variance (ANOVA) and Bonferroni post hoc test.

