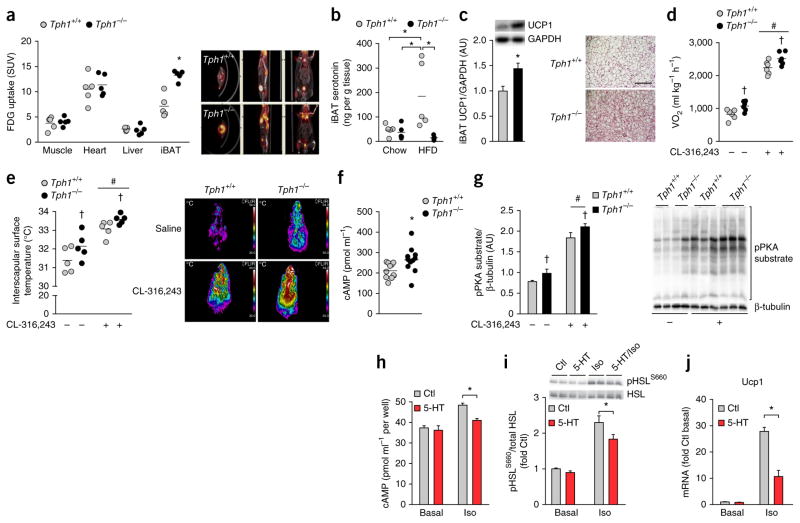
Figure 2.
Mice lacking Tph1 have increased metabolic rate and brown adipose tissue activity due to an inhibition of β–adrenergic signaling by serotonin. (a) Tissue FDG uptake in Tph1+/+ and Tph1−/− mice fed a HFD (n = 5 per group). SUV, standardized uptake values. (b,c) iBAT serotonin content determined by ELISA (n = 5 per group) (b) and UCP1 protein content (n = 8 Tph1+/+ and n = 7 Tph1−/−) (left, c) from iBAT of Tph1+/+ and Tph1−/− mice fed a HFD as assessed by western blot (top, c) and tissue sections stained with H&E (right, c; scale bar is 50 μm). AU, arbitrary units. (d,e) Oxygen consumption (n = 6 per group) (d) and dorsal interscapular surface temperature (e) of anesthetized HFD-fed Tph1+/+ and Tph1−/− mice following injection with saline or CL-316,243 (n = 5 per group). Right (e), representative thermal images of mice injected with saline or CL-316,243. (f) cAMP levels determined by ELISA in iBAT of HFD–fed Tph1+/+ and Tph1−/− mice (n = 11 per group). (g) Relative PKA substrate phosphorylation in iBAT of HFD-fed Tph1+/+ and Tph1−/− mice 15 min following an injection of saline or CL-316,243 (n = 5 per group, right: representative western blot). (h–j) cAMP (n = 3 per treatment in two separate experiments) (h) HSL phosphorylation (S660, n = 5 per treatment in two separate experiments) (i) and Ucp1 mRNA (j) in control and isoproterenol-stimulated brown adipocytes (n = 4 per treatment in two separate experiments). Data are expressed as means ± s.e.m. *P < 0.05 relative to Tph1+/+ mice or Ctl, #P < 0.05 relative to saline or †P < 0.05 versus Tph1+/+ as determined using a Student’s t-test or, where appropriate, a two-way analysis of variance (ANOVA) and Bonferroni post hoc test.

