Figure 3.
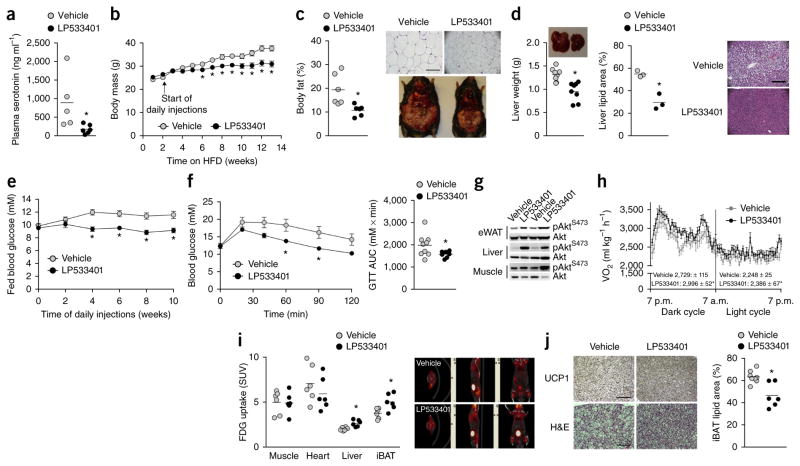
Chemical inhibition of Tph1 prevents obesity and insulin resistance and increases brown adipose tissue activity and UCP1 expression in HFD-fed C57BL/6 mice. (a) Plasma serotonin concentrations of HFD-fed C57BL/6 mice after 8 weeks of LP533401 treatment (n = 5 vehicle and n = 6 LP533401 treated). (b) Body mass of HFD-fed C57BL/6 mice over 14 weeks treated with vehicle or LP533401 for the last 12 weeks (n = 9 vehicle and n = 8 LP533401). (c) Adiposity of vehicle- and LP533401-treated mice (n = 6 vehicle and LP533401). Top right, H&E-stained sections of eWAT, scale bar is 100 μm; bottom right, representative images of mice from each treatment group. (d) Liver weight (n = 9 vehicle and n = 8 LP533401) and lipid area fraction (n = 3 vehicle and LP533401) in vehicle- and LP533401-treated, HFD-fed mice. Right, H&E-stained sections of liver from vehicle- and LP533401-treated, HFD-fed mice; scale bar is 100 μm. (e,f) Fed blood glucose over the treatment period (e) and GTT (f) of vehicle- and LP533401-treated, HFD-fed mice and AUC. n = 9 vehicle and n = 8 LP533401 for all three graphs. (g) AktS473 phosphorylation relative to total Akt in liver, eWAT and mixed gastrocnemius muscle from vehicle- and LP533401-treated mice 15 min following an injection of 0.5 U kg−1 insulin (n = 9 vehicle and n = 8 LP533401). (h,i) Oxygen consumption during light and dark cycles (n = 7 per group) (h) and tissue FDG uptake (n = 6 per group) (i) in vehicle- and LP533401-treated mice. Right (i), representative PET-CT images from each group. (j) Representative immunohistochemical staining of UCP1 (top, scale bar is 100 μm) and H&E (bottom, scale bar is 50 μm) representative of 8 vehicle- and 6 LP533401-treated mice and lipid area fraction in iBAT (right) from mice treated with vehicle or LP533401 (n = 8 vehicle and n = 6 LP533401). Data are expressed as means ± s.e.m. *P < 0.05 compared to vehicle as determined using a Student’s t-test or, where appropriate, using a two-way repeated measures ANOVA.

