
Figure 3.
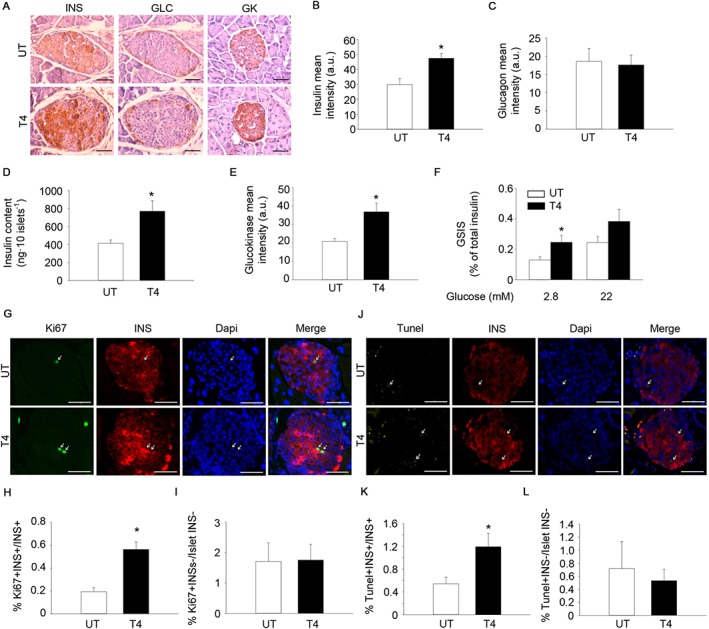
T4 increases insulin expression and enhances the proliferation of pancreatic beta cells. (A) Representative images of insulin (INS), glucagon (GLC) and glucokinase (GK) staining in pancreas from mice treated or not with T4. Diaminobenzidine staining followed by haematoxylin counterstaining. Scale bar = 50 μm. INS; n = 5 per group. GLC; n = 5 per group. GK; n = 6 per group. (B) Quantification of insulin staining (mean intensity). (C) Quantification of glucagon staining (mean intensity). (D) Determination of pancreatic islet insulin content by elisa. n = 6 untreated, n = 7 T4‐treated. (E) Quantification of glucokinase staining (mean intensity). (F) Determination of GSIS. n = 6 untreated, n = 7 T4‐treated. (G) Representative images of Ki67 and insulin staining in pancreases from mice treated or not with T4. Immunofluorescence followed by DAPI staining. Scale bar, 50 μm. n = 5 per group. (H) Percentage of Ki67+‐Insulin+ cells over total insulin+ cells. (I) Percentage of Ki67+‐Insulin− cells over total insulin− cells residing in pancreatic islets. (J) Representative images of TUNEL and insulin staining in pancreas from mice treated or not with T4. Immunofluorescence followed by DAPI staining. Scale bar = 50 μm. n = 5 per group. (K) Percentage of TUNEL+‐Insulin+ cells over total insulin+ cells. (L) Percentage of TUNEL+‐Insulin− cells over total insulin− cells residing in pancreatic islets. UT, untreated; T4, T4‐treated. Arrows indicate representative positive staining. Data shown are the means ± SEM. *P < 0.05 significantly different from untreated mice; two tailed Student's t‐test.