
Figure 4.
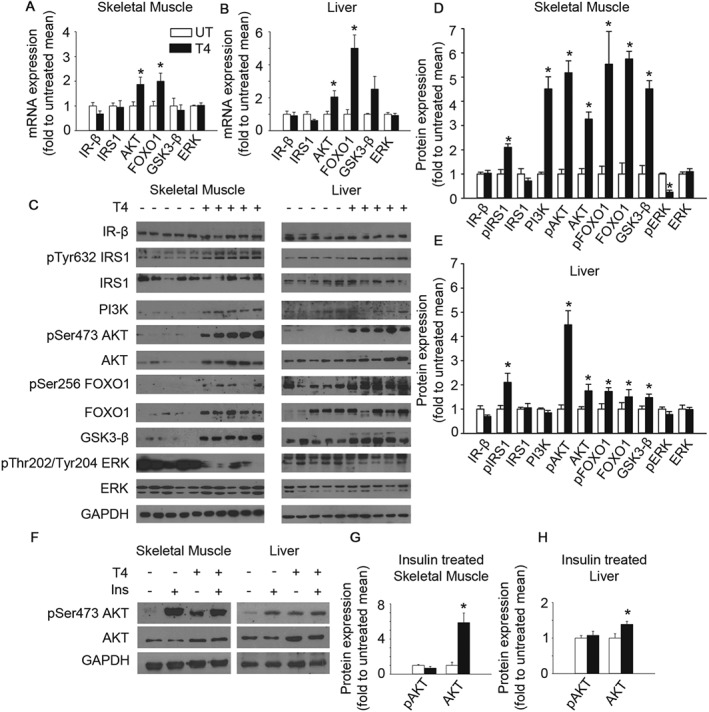
T4 activates insulin signalling in skeletal muscle and liver. (A) Determination of mRNA levels of several members of the insulin pathway in the skeletal muscle of mice treated or not with T4. Mice were fasted for 16 h before they were killed. Values were normalized to untreated mice. IR‐β; n = 5. IRS1; n = 6. Akt; n = 5. FOXO1; n = 6. GSK3‐β; n = 6. ERK; n = 6. (B) Determination of mRNA levels of several members of the insulin pathway in the liver of mice treated or not with T4. Mice were fasted for 16 h before they were killed. Values were normalized to untreated mice. IR‐β; n = 6 untreated, n = 5 T4‐treated. IRS1; n = 6 untreated, n = 5 T4‐treated. AKT; n = 6. FOXO1; n = 6 untreated, n = 5 T4‐treated. GSK3‐β; n = 5. ERK; n = 6 untreated, n = 5 T4‐treated. (C) Western blots indicating activation of insulin signalling in the skeletal muscle and the liver of T4‐treated mice. Mice were fasted for 16 h before they were killed. n = 5 per group. (D) Densitometric analysis of the Western blots using skeletal muscle extracts shown in panel C. Values were normalized to untreated mice. (E) Densitometric analysis of the Western blots using liver extracts shown in panel C. Values were normalized to untreated mice. (F) Representative images of Western blots showing the maximal activation of insulin signalling in T4‐treated and untreated mice challenged with an insulin injection (0.75 U·kg−1 of body weight) 15 min prior euthanization. Mice were fasted for 16 h before they were killed. (G) Densitometric analysis of the Western blots using skeletal muscle extracts shown in Supporting Information Figure S4A. n = 5 untreated, n = 6 T4‐treated. Values were normalized to untreated mice. (H) Densitometric analysis of the Western blots using liver extracts shown in Supporting Information Figure S4A. n = 5 untreated, n = 6 T4‐treated. Values were normalized to untreated mice. UT, untreated; T4, T4‐treated. Data shown are the means ± SEM. *P < 0.05, significantly different from untreated mice; two tailed Student's t‐test.