
Figure 5.
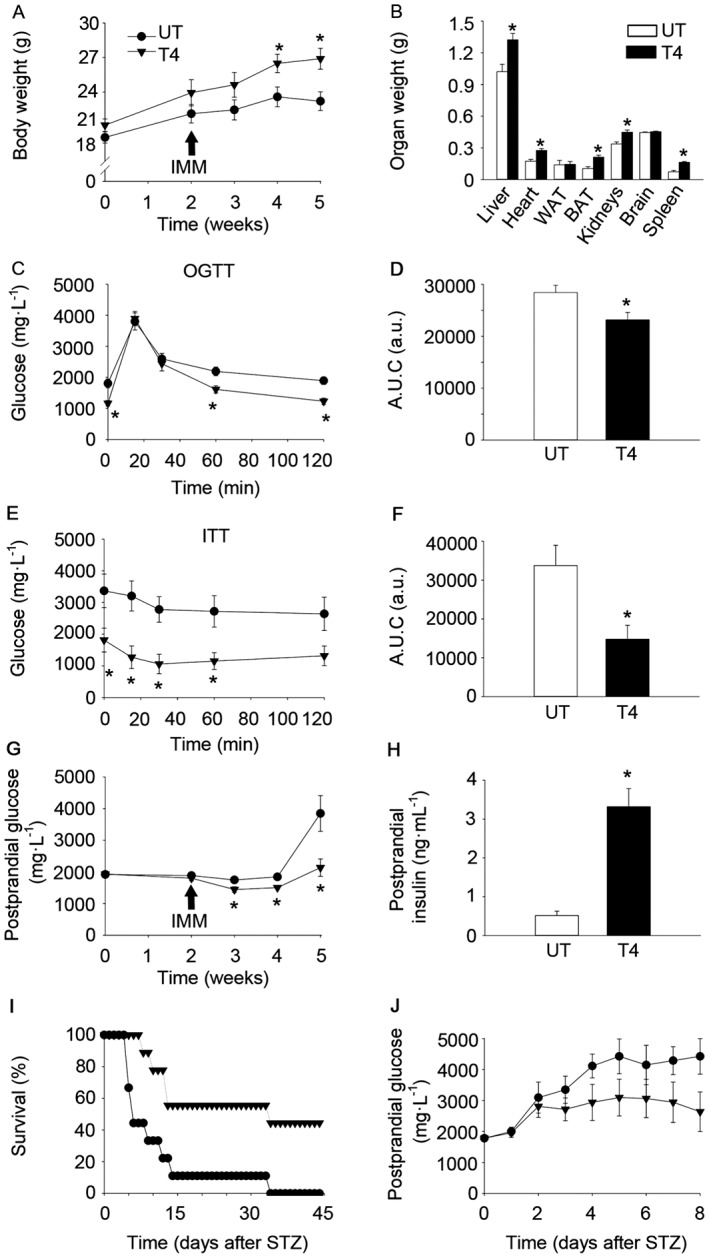
T4 blunts the onset of T1DM in the RIP‐B7.1 model of EAD and increases survival in STZ‐challenged C57BL/6 mice. (A) Body weight of RIP‐B7.1 mice. n = 8 untreated; n = 9 T4‐treated. (B) Organs weight of RIP‐B7.1 mice. n = 6 untreated; n = 9 T4‐treated. (C) Glucose concentration in blood during an OGTT at 4 weeks of T4‐treatment of RIP‐B7.1 mice. n = 8 untreated; n = 9 T4‐treated. (D) AUC of glucose levels during the OGTT. (E) Glucose concentration in blood during and ITT at 5 weeks of T4‐treatment of RIP‐B7.1 mice. n = 7 untreated; n = 9 T4‐treated. (F) AUC of glucose levels during the ITT. (G) Postprandial glucose concentration in blood on RIP‐B7.1 mice. n = 8 untreated; n = 9 T4‐treated. (H) Circulating insulin levels in fed conditions. n = 7 untreated; n = 8 T4‐treated. (I) Survival of C57BL/6 mice challenged with STZ. n = 9 per group. (J) Postprandial glucose concentration in blood from C57BL/6 mice challenged with STZ. Alive animals were included (see Figure 5I for n in each time point). UT, untreated; T4, T4‐treated; IMM, immunization. Arrows indicate the time of immunization. Data shown are the means ± SEM *P < 0.05, significantly different from untreated mice; two tailed Student's t‐test. A LogRank survival test was applied to survival curves.