
Figure 2.
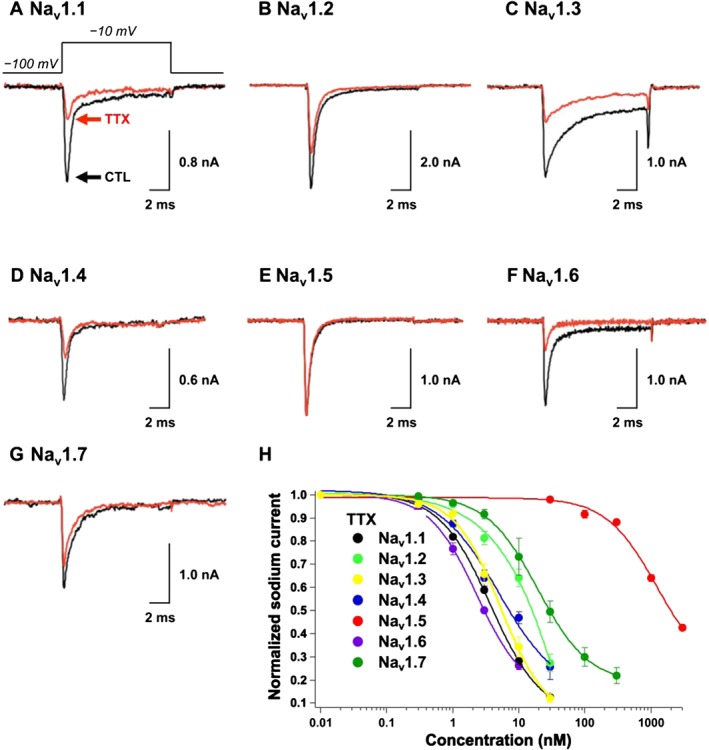
Inhibitory effects of TTX (1) on Nav1.1–Nav1.7 expressed in HEK293T cells. The sodium currents in (A) Nav1.1, (B) Nav1.2, (C) Nav1.3, (D) Nav1.4, (E) Nav1.5, (F) Nav1.6 and (G) Nav1.7 were recorded in the absence (black line) and presence (red line) of TTX (1). The TTX concentration was 10 nM in (A−D, F, G) and 30 nM in (E). (H) The dose‐dependent inhibitory effects of TTX (1) on Nav1.1, Nav1.2, Nav1.3, Nav1.4, Nav1.5, Nav1.6 and Nav1.7 are shown.