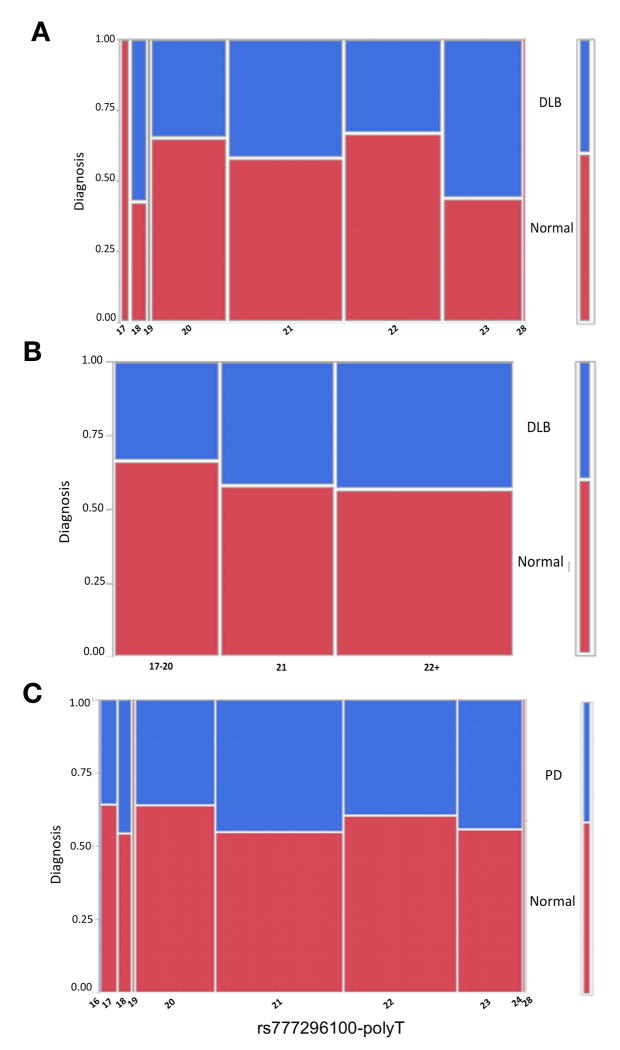
Figure 5. Mosaic plots of the proportion of individuals with diagnoses of PD or DLB compared to cognitively normal stratified by the number of rs777296100 poly-T bases.
Each column in the plot corresponds to specific poly-T lengths; the rows correspond to diagnoses and have an associated color code defined in the key at the far-right side of each plot (cognitively normal is red). The height of the color-coded block in each poly-T category shows the proportion of individuals with each specific neuropathological diagnosis that have associated rs777296100 (dbSNP 147) genotypes. The scale of the y-axis (far left) shows the proportions for each diagnosis, with the entire subset of individuals in a risk category corresponding to 1. The width of the columns are proportional to the group sample size. (A) Dementia with Lewy bodies (DLB) versus cognitively normal, (B) DLB versus cognitively normal with the poly-T lengths assigned to categories, (C) Parkinson’s disease (PD) versus cognitively normal. NOTE: rs777296100 (dbSNP 147) is denoted as rs33988309 dbSNP build 142.

