Abstract
The refractive index (RI) of biological materials is a fundamental parameter for the optical characterization of living systems. Numerous light scattering technologies are grounded in a quantitative knowledge of the refractive index at cellular and subcellular scales. Recent work in quantitative phase microscopy (QPM) has called into question the widely held assumption that the index of the cell nucleus is greater than that of the cytoplasm, a result which disagrees with much of the current literature. In this work, we critically examine the measurement of the nuclear and whole-cell refractive index using QPM, validating that nuclear refractive index is lower than that of cytoplasm in four diverse cell lines and their corresponding isolated nuclei. We further examine Mie scattering and phase-wrapping as potential sources of error in these measurements, finding they have minimal impact. Finally, we use simulation to examine the effects of incorrect RI assumptions on nuclear morphology measurements using angle-resolved scattering information. Despite an erroneous assumption of the nuclear refractive index, accurate measurement of nuclear morphology was maintained, suggesting that light scattering modalities remain effective.
Keywords: refractive index, nucleus, phase imaging, microscopy, Mie theory, light scattering
Graphical Abstract
Recent studies using quantitative phase microscopy have suggested that the nuclear refractive index is lower than that of cytoplasm. In this paper, we verify this claim in new cell lines, including non-cancerous and primary lines. We further validate against potential corrupting factors, and examine the impact that a low nuclear index would have on light scattering technologies.
1. Introduction
Accurate characterization of the refractive index (RI) of biological materials is important for both biomedical diagnostics and fundamental cell biology. Diagnostic modalities such as angle-resolved low-coherence interferometry [1, 2], light scattering spectroscopy [3, 4] and elastic scattering spectroscopy [5, 6] depend on knowledge of the nuclear and cytoplasmic RI for obtaining diagnostic information. Knowledge of the subcellular RI distribution is also employed for basic research methods, producing results that illuminate mechanisms of light scattering in tissue [6], enable measurement of oxidative stress in mitochondria [7], and add morphological information to Raman spectroscopy [8]. Tissue Optics by V.V. Tuchin [9], a highly cited text in the field, reports the ratio of nuclear to cytoplasmic refractive index m to range from 1.01 to 1.08 for healthy cells, where m > 1 indicates that the nuclear refractive index is greater than that of cytoplasm. This is further endorsed by numerous light scattering studies [10–12] and evidenced in the success of diagnostic modalities based on these measurements [13–15].
Recently, measurements using quantitative phase microscopy have led to a reexamination of the nuclear refractive index. QPM uses interferometry to map the phase delay experienced by photons passing through a thin sample, and has been used for a wide range of biological applications [16, 17]. The extension of QPM to tomographic imaging, known as Tomographic Phase Microscopy (TPM) allows for three-dimensional rendering of refractive index maps with subcellular resolution. Interestingly, studies using TPM have reported that the nuclear RI is less than the cytoplasmic RI [18, 19], which disagrees with the reports mentioned above.
Since optical phase delay is a function of both pathlength and refractive index, standard QPM cannot measure the RI of a sample without a priori knowledge of the sample geometry. Schürmann et al. recently isolated individual cell nuclei, and by simply assuming sphericity, calculated values for the nuclear and whole-cell refractive indices, also observing m < 1 [20]. This assumption allows decoupling of pathlength and RI from phase measurements, and was verified to be an accurate characteristic of freshly plated cells and nuclei using confocal microscopy.
In this paper, we use QPM to validate the claim of low nuclear RI in four cell lines and their corresponding isolated nuclei. Previous work has focused on cancerous lines only, so here we extend our study to examine a non-cancerous, virally transformed line (BEAS-2B) as well as a primary cell line (Human Vaginal Epithelium, or HVE) to determine whether the observation of m < 1 is a specific property of cancerous cells. We also examined Mie scattering and phase wrapping as potential corrupting factors to determine whether these effects could contribute to erroneous phase measurements of spherical structures using QPM. Finally, we examined the implications of these findings on light scattering technologies by simulating angular scattering spectra for a range of test samples with m < 1, and analyzed their structure using a library of angular spectra which assumes m > 1, as is usually done. The ability to obtain structural measurements with angle-resolved scattering, despite an imprecise assumption of the nuclear RI, is discussed.
2. Methods
2.1. Cell Culture and Nuclear Isolation
To characterize the refractive index of nuclear and cytoplasmic material across a range of cell types, four cell lines of varying origin were imaged using QPM. Two cancerous lines from breast (MCF-7, ATCC) and lung (A549, ATCC) were selected, along with a non-cancerous, virally transformed lung epithelial line (BEAS-2B, ATCC) and a primary line (HVE, Celprogen) to ensure that a low nuclear RI is not an anomalous property of cancer. Only MCF-7 cells have been previously examined for quantification of refractive index using QPM [20]. This cell line was purposefully included to validate our measurements against those in the literature. A detailed description of culture methods, along with nuclear isolation protocols, is provided in the Supporting Information.
2.2. Quantitative Phase Microscopy
The QPM setup has been described in previous publications [21]. Light from a supercontinuum source was filtered spectrally to pass only one selected wavelength at a time, with a bandwidth of ~1 nm to remove coherent artifacts. This beam was split into sample and reference arms, and pathlength-matched using identical 40x objectives, NA=0.75. A thin sample was placed in the sample arm, and transmitted photons were recombined with the reference beam and imaged onto a high-speed CMOS camera (Photron Fastcam SA4). The sample and reference beams were aligned with a slight angle between them, implementing an ‘off-axis’ geometry which allows for single-shot hologram acquisition. Integration time was varied between 1 and 17 ms to fill the dynamic range of the detector for each chosen wavelength, λ=540–720 nm.
The off axis holograms were processed using standard procedures to produce quantitative phase images [22]. Briefly, raw interferograms were Fourier transformed, the complex signal field was isolated, and the result was inverse-transformed to isolate the complex sample field. The argument of the field was taken to create a phase map, and unwrapping was performed using Goldstein’s algorithm to remove 2π ambiguities [23].
2.3. RI Quantification of Cells and Nuclei
Methods for quantification of nuclear and cellular RI from single phase images is described in the literature [20]. Cells and isolated nuclei in PBS were placed in a 120 μm deep chamber using a spacer between two coverslips for imaging. To quantify the cellular and nuclear RI, quantitative phase maps from QPM were fit using a circular Hough Transform to create a thickness profile, where the thickness at each pixel is the projected depth of a sphere defined by the circular fit. The generation of a thickness profile allows decoupling of the contributions of RI and sample thickness to the optical phase at each pixel, allowing construction of a refractive index map. Because this technique measures relative RI only, the refractive index of PBS (RIPBS=1.335) was used to calculate an absolute RI map. The RI of each sample was determined as the average of all pixels >2 μm from the object border to avoid edge effects, where the average nuclear and whole-cell diameters were roughly 9 and 13 μm, respectively. Because our QPM system is wavelength-tunable, we collected images of each sample at four wavelengths (λ=540–720 nm in increments of 60 nm) to quantify the chromatic dispersion, i.e. the variation of RI with wavelength, of cellular material. The use of multiple wavelengths also allows for synthetic wavelength imaging [24] to reveal hidden phase wraps, as described in the next section. All imaging was performed within 45 minutes of plating to ensure sphericity of the sample, and only cells and nuclei that were visually confirmed to have a high degree of cross-sectional circularity were selected for imaging. Between 10 and 30 cells and nuclei were imaged from each cell line.
2.4. Examination of Corrupting Factors
To date, the claim of a low nuclear refractive index is specific to phase-based measurement systems. To investigate if there was a particular aspect of the technique that may have caused an error, we examined two potential sources, Mie scattering and phase unwrapping. A fundamental assumption of QPM is that the Born approximation is valid, i.e. photons are simply transmitted through the sample, with the optical phase delay based on RI and pathlength only. On the other hand, Mie theory presents a complete solution which includes refractions, reflections, and interferences of all orders. A mathematical treamtent of this interaction and its application to QPM-based phase measurements of spheres is presented in the Supporting Information.
The second possible source of error which we consider is phase wrapping. A fundamental limitation of QPM is the inability to measure phase data outside of a single optical cycle, or >2π radians. To account for this, phase unwrapping algorithms are generally employed to find and correct likely points of phase wrapping by adding multiples of 2π.
For each image in this study, Goldstein’s algorithm was used to unwrap the two-dimensional phase data. Goldstein’s approach works by minimizing path integrals across the phase image [23], and works well for slowly varying phase data. Unfortunately, this approach often fails at a sharp edge, defined as a pixel-to-pixel variation of greater than π. This error manifests as a steep edge becoming artificially smooth, and can affect entire regions of the image [25].
Because the phase profile of a sphere is quite steep at the boundary, it is possible that a nucleus of high refractive index could be measured as artificially low due to failed phase unwrapping at its boundary. To account for this, we employed a two-wavelength unwrapping algorithm derived by Cheng [26] and implemented previously by our group [25] to reconstruct the true phase profile. The two-wavelength algorithm works by creating an optical path difference (OPD) map using phase maps at two separate wavelengths [26], and adding 2π to points at which the two-wavelength OPD differs from the single wavelength OPD by at least 0.5 μm [25]. This extends the dynamic range of QPM to be unambiguous over the “beat” wavelength of Λ=λ1λ2/|λ1-λ2|, and weakens the sampling requirement of Goldstein’s method by a factor of Λ/λ1. In this study, λ1=540 nm and λ2=660 nm were found to give the most accurate reconstructions of incorrectly unwrapped images of polymer microspheres, corresponding to a beat wavlength of Λ=2.97 μm. The two-wavelength algorithm was applied to all images presented in this study to account for the possibility of hidden phase wrapping.
2.5. Implications for Nuclear Morphology Measurements
The development of light scattering techniques has enabled non-invasive measurement of nuclear morphology [3, 27]. Techniques like angle-resolved low-coherence interferometry (a/LCI) measure nuclear morphology by comparing the angular scattering spectrum with a library of precomputed spectra [1]. To date, a/LCI has demonstrated high diagnostic accuracy for detecting dysplasia by comparing measured light scattering distributions to databases composed entirely of simulated scattering spectra for objects with m > 1. To understand the impact of a mismatch between physical and library refractive indices, we examined the ability to determine the morphology of low-index nuclei (m < 1) using a library consisting entirely of high-index angular spectra (m > 1).
MiePlot (v4.6) [28] was used to generate ~2,000 Mie spectra with m < 1, each corresponding to a unique combination of nuclear RI (1.34–1.36, increments of 0.01), cytoplasmic RI (1.36–1.40, increments of 0.01) and diameter (5–18 μm, increments of 0.1 μm) which encompass the range of parameters seen for cells measured in this work. Each nuclear diameter was modelled using a size distribution typically found in tissue of 10% [29], and Gaussian white noise was added to each signal, at a level of SNR=10, to simulate experimental measurement conditions. Fitting of these test data was performed using the library of angular spectra with m > 1 employed in clinical a/LCI studies [30, 31], with nuclear RI ranging from 1.42–1.47, cytoplasmic RI of 1.36–1.38, nuclear diameter 5–18 μm, and size distributions of 2.5%, 5%, 7.5%, and 10%.
To perform a/LCI fitting [32], each spectrum was normalized, and a second-order polynomial was subtracted to isolate the angular frequencies of interest. The best fit was calculated as the library spectrum which minimized chi-squared error for the first 30° of backscattering, with mean-squared error calculated over 300 equally spaced angles (Δθ = 0.1°). Only unique fits, for which the best fit from the library was at least 10% better than the next best, were included in the results to avoid degenerate size measurements.
Clinical a/LCI measurements employ sample averaging, where multiple acquisitions are combined to prevent a single noisy measurement from corrupting analysis of a tissue site. In the numerical studies presented here, the effects of averaging multiple measurements were also considered to mirror the typical acquisition procedure used in the clinic. For each spectrum in the simulation, N=7 random test spectra were combined, where the RI parameters were held constant, but the size parameter was varied randomly by up to 10%. The fitted diameter in this case was calculated as the average of the fitted diameters obtained for the seven individual scans.
Recent work in a/LCI has focused primarily on the detection of cervical dysplasia [30]. Here, we have evaluated a primary cell line (HVE) from vaginal epithelium for its histological similarity to ectocervical epithelium. We used parameters derived from our RI measurements of this cell line to develop a simulation of healthy and dysplastic cervical tissue. Since the measurements presented here quantify the RI of nuclei and whole cells (not cytoplasm), we estimated the RI of cytoplasm ΔRIcyt by assuming a contribution equal to the volume ratio,
| (1) |
where is the volume fraction of the nucleus taken from averaged diameter measurements in QPM (ηnuc = 0.346), and ΔRIi is the difference between the refractive index of the specified medium and the background, RIPBS = 1.335. Mean RI of vaginal nuclei at λ=720 nm was 1.3425, and RIcyt was calculated from Eq. (1) at 1.388. Because all simulations were performed at 792.1 nm (a common a/LCI wavelength), and our QPM system does not extend to this wavelength, RI values of 1.34 for the nucleus and 1.39 for the cytoplasm were chosen as good approximations.
Representative nuclear diameters for healthy and dysplastic cervical epithelium (8.25 and 13 μm, respectively) were taken from the literature [33], and populations of N=100 “tissue sites” were created by randomly varying the mean diameter across a normal distribution, with a 10% standard deviation extrapolated from the literature [29].
3. Results and Discussion
3.1. RI of Cells and Nuclei
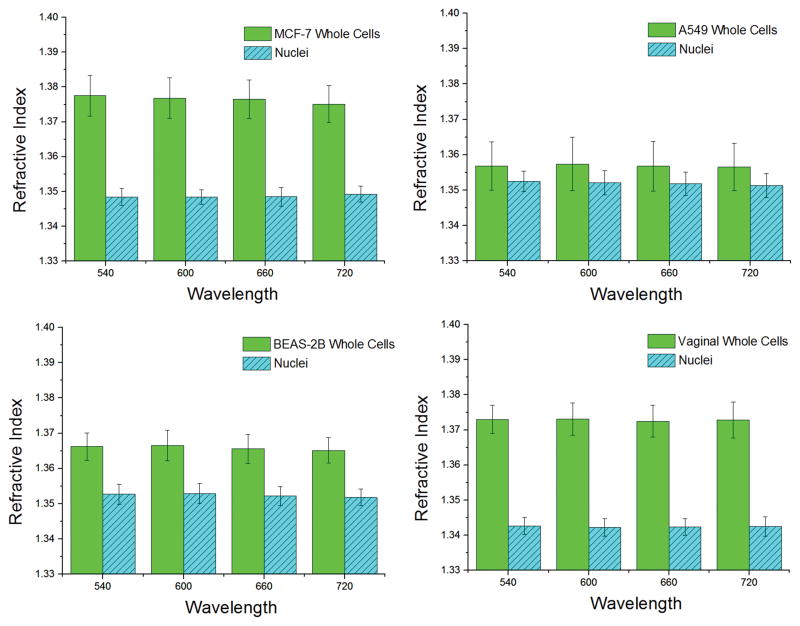
The refractive index for all cells and nuclei examined in this study is shown in Figure 1. At λ=540 nm, the refractive indices of whole cells were 1.3775 ± 0.0058 for MCF-7, 1.3568 ± 0.0068 for A549, 1.3662 ± 0.0039 for BEAS-2B, and 1.3730 ± 0.0040 for HVE. For nuclei, RI was measured at 1.3509 ± 0.0042 for MCF-7, 1.3524 ± 0.0029 for A549, 1.3527 ± 0.0028 for BEAS-2B, and 1.3427 ± 0.0024 for HVE, also at 540 nm. Our values for MCF-7 cells and nuclei agree well with the literature, where slight differences in RI of ~0.005 are likely due to differences in illumination wavelength, circular fitting algorithms, and pixel-weighting [20]. The typical chromatic dispersion for the whole cell was 1.36·10−5 nm−1 for MCF-7 cells, and <10−5 nm−1 for all other lines. For nuclei, chromatic dispersion never exceeded 10−5 nm−1.
Figure 1.
Refractive index of whole cells and nuclei for each chosen cell line at each chosen wavelength. Chromatic dispersion of cellular material is generally 10−5 nm−1 or less. The number of samples analyzed was Ncell = 16, 17, 12, 25 and Nnuc = 10, 15, 15, 19 for MCF-7, A549, BEAS-2B, and HVE whole cells and nuclei, respectively. A nuclear refractive index which is lower than that of cytoplasm appears to be an accurate characterization of the cellular substructure.
3.2. Corrupting Factors
A rigorous treatment of Mie reflection orders is presented in the Supporting Information (Section S2). For biologically relevant refractive indices, <1.6% of the total energy is contained in higher order reflections capable of corrupting the phase measurement, while >96.3% is first-order transmission as assumed by QPM. From this, we may conclude that Mie scattering produces negligible effects on the phase for values of m near 1. For further discussion, please see the Supporting Information.
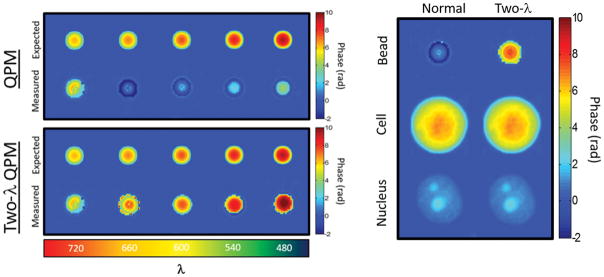
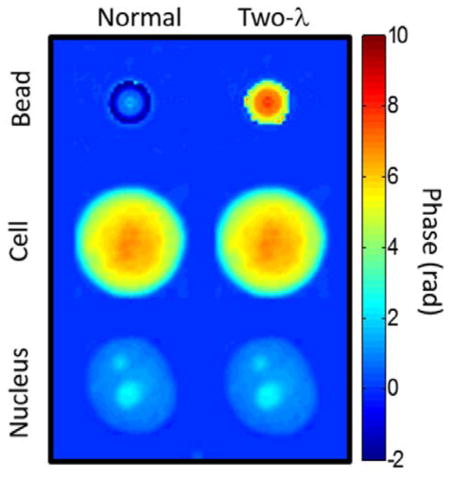
A more pressing concern was the possibility of missing 2π phase ambiguities at the boundary of the cell or nucleus. Figure 2 shows validation of the two-wavelength technique by properly unwrapping the phase profile of 6 μm polymer microspheres (RI=1.59) in glycerol (RI=1.47). Prior to two-wavelength reconstruction, phase imaging of microspheres substantially underestimated the true phase due to a failure of Goldstein’s algorithm at the sphere’s edge (Figure 2, left panel). However, examination of nuclei used in this study (Figure 2, right panel) showed no hidden phase wraps in any of the phase images, indicating that the measured phase is equal to the true optical phase delay and not a product of failed phase unwrapping. Every cell and nucleus in this study was examined for hidden phase wrapping, but two-wavelength imaging revealed no additional phase in any of the samples.
Figure 2.
(Top Left) Standard QPM fails to properly reconstruct the phase profile of a polymer microsphere for λ ≤ 660 nm. (Bottom left) Synthetic wavelength imaging with two wavelengths (Two-λ QPM) reveals hidden phase wraps which were not properly reconstructed by Goldstein’s algorithm. (Right) Two-λ QPM was applied to all cells and nuclei in the study (Pictured: MCF-7), though no additional 2π phase delays were uncovered in any cell or nucleus. Phase wrapping does not cause artificial reduction of the RI measurement of nuclei using QPM.
3.3. Implications for Nuclear Morphology Measurements
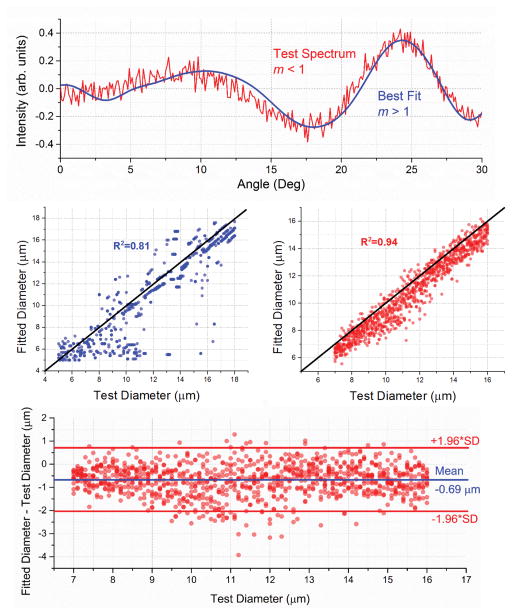
Figure 3 shows the results of simulated nuclear sizing with a/LCI, where the test spectra are generated from a library of angular spectra with m < 1. Nuclear morphology was then analyzed by fitting the test spectra to a library with m > 1. When using individual measurements, the accuracy of size determination is limited (R2 = 0.81, mean absolute error = 1.36 μm). However, when averaging multiple measurements, the size estimation becomes much more accurate (R2 = 0.94, mean absolute error = 0.78 μm) with half of the error coming from a systematic offset of 0.691 μm. A random error with standard deviation 0.689 μm is also present. A Bland-Altman plot visualizing these errors is included in Figure 3.
Figure 3.
Simulated fitting of angular scattering spectra from low-index nuclei, using a high-index lookup table. (Top) A sample angular spectrum, m < 1, along with its best fit, m > 1. In this case, the nuclear diameter is correctly determined to be 12.7 μm. (Middle left) All simulations on the parameter space. Size accuracy is limited for individual measurements. (Middle Right) Average fit for groups of N=7 spectra with a size standard deviation of 10% from the test diameter. (Bottom) Bland-Altman plot for the size-averaged fits. Half of the error comes from a systematic offset of 0.691 μm, which does not affect diagnostic accuracy. Ignoring the offset, the remaining error has standard deviation of 0.689 μm. Red lines indicate 95% limits of agreement, or ±1.96 times the standard deviation of the error. All simulations were performed at 792.1 nm, the measured center wavelength of a benchtop a/LCI system in our lab.
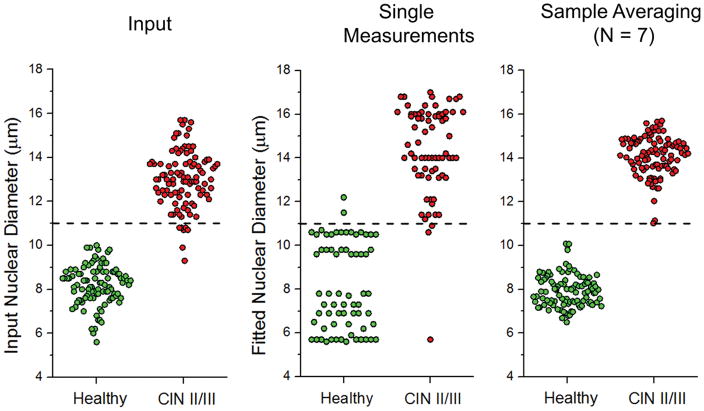
An analysis of the simulated clinical data is shown in Figure 4. The left panel shows the input distribution with size 8.25 ± 0.83 μm for healthy and 13.00 ± 1.30 μm for dysplastic nuclear diameters, with RI values (RInuc = 1.34, RIcyt = 1.39) determined by our QPM measurements of HVE cells. The center panel shows that nuclear sizing. using the standard a/LCI library with m > 1 can produce substantial error, manifesting as a spread of the healthy population from 8.25 ± 0.83 μm to 8.14 ± 1.97 μm, and a shift in the dysplastic population from 13.00 ± 1.30 μm to 14.39 ± 2.01 μm. Upon averaging multiple measurements, however, the analysis produces results which are more similar to the input nuclear diameters, 7.94 ± 0.73 μm for healthy, and 14.1 ± 0.89 μm for dysplastic nuclei. No overlap is observed between the final distributions. Diagnostic capability (the ability to determine healthy from dysplastic tissue) is preserved, despite an incorrect range of RI values in the library.
Figure 4.
(Left) Distribution of mean nuclear diameters for simulated healthy and dysplastic cervical tissues, N=100 each. CIN II/III represents expected nuclear morphology for a high-grade squamous intraepithelial lesion (HSIL). (Middle) Individual size measurements of the input diameters on the left using the m > 1 library. (Right) Sample averaging of N=7 improves diagnostic accuracy. The measured healthy distribution is indistinguishable from the input, p > 0.1. The dysplastic population is systematically shifted upwards by 1 μm, but indistinguishable from the input (p > 0.5) when this is corrected. A suggested decision line at 11 μm is included for illustrative purposes.
3.3 Discussion
The observation of a low nuclear refractive index is relatively new, and brings up questions for light scattering techniques which rely on this parameter. While it appears convenient that nuclear morphology measurements using light scattering maintain accuracy despite imprecise assumptions, theory suggests that angular scattering from low-index spheres will be similar to high index spheres when m~1. By Babinet’s Principle, the diffractive component of light scattering will be identical in the far field for both a low and high-index sphere of the same cross-sectional area. Further, van de Hulst [34] notes that the first-order refracted light (which dominates for m~1) will be identically distributed over scattering angles for spheres of index m and 1/m.
In our simulations, approximately half of the error in nuclear size was systematic, while the other half was random. Because light scattering is typically used to distinguish morphology between two populations (e.g. healthy and dysplastic) a systematic error will not affect the diagnostic accuracy, and the error of the measurement is limited to the sub-wavelength random error ε=0.689 μm.
Accurate measurement of nuclear diameter despite incorrect RI is also born out in the literature. Ho et al [35] successfully used angular scattering to measure the nuclear diameter of MCF-7 cells (11.89 ± 0.70 μm, compared with 11.8 ± 1.8 μm from image analysis) by fitting angular scattering to a library of spectra with m > 1. Furthermore, numerous studies have demonstrated the diagnostic capability of a/LCI both in vivo and in vitro, as mentioned earlier. Additional work is needed to determine whether correction of the nuclear RI will improve photonic diagnostic tools like a/LCI.
All cell lines in this study exhibited epithelial morphology, as epithelial tissue is the primary target for light scattering tissue diagnostics. Examination of more diverse cell types will determine whether a low nuclear RI is a universal property of eukaryotic cells.
It is conceivable that the nuclear isolation process could have some impact on the measured nuclear refractive index. However, Schürmann et al. used immunofluorescence to show that there was no significant leakage of nuclear material using the IGEPAL method [20]. They further note that a substantial loss of nuclear material (>80%) would be necessary to invalidate the finding that RInuc < RIcyt. Our finding that the REAP and IGEPAL methods produce identical results in MCF-7 cells (see Supporting Information) suggests that a loss of nuclear material is a minimal concern with either method.
In contrast with the optically homogeneous sphere implied by Mie theory, several nuclei in this study exhibited one or more high-index nucleoli. Future work using finite element methods should prove instrumental in understanding the contributions of sub-nuclear structures to the angular scattering spectrum.
4. Conclusion
To conclude, we have measured nuclear and whole-cell refractive indices for a broad range of cell lines using QPM, observing RInuc < RIcyt in cancerous, non-cancerous, and primary cell lines. Further, we showed that this measurement is not an artificial result of Mie scattering or phase wrapping. Finally, we examined the use of angular scattering to quantify nuclear morphology, and noted that multi-sample averaging produces size measurements with small error, despite erroneous assumptions of the nuclear RI. The clinical implication is that diagnostic accuracy appears to be preserved in the initial examination shown here. However, a re-examination of the vast literature on light scattering from cell nuclei, ranging from in vitro to in vivo measurements, is warranted to assess the net influence on this incorrect assumption.
Supplementary Material
Acknowledgments
Support from NIH R01 CA167421, NSF CBET 1604562, and the NSF-GRFP program is gratefully acknowledged.
References
- 1.Wax A, Chalut KJ. Anal Cell Pathol. 2011;34:207–222. doi: 10.3233/ACP-2011-0017. [DOI] [PMC free article] [PubMed] [Google Scholar]
- 2.Wax A, Yang C, Backman V, Badizadegan K, Boone CW, Dasari RR, Feld MS. Biophys J. 2002;82:2256–2264. doi: 10.1016/S0006-3495(02)75571-9. [DOI] [PMC free article] [PubMed] [Google Scholar]
- 3.Perelman L, Backman V, Wallace M, Zonios G, Manoharan R, Nusrat A, Shields S, Seiler M, Lima C, Hamano T. Phys Rev Lett. 1998;80:627. [Google Scholar]
- 4.Wallace MB, Perelman LT, Backman V, Crawford JM, Fitzmaurice M, Seiler M, Badizadegan K, Shields SJ, Itzkan I, Dasari RR. Gastroenterol. 2000;119:677–682. doi: 10.1053/gast.2000.16511. [DOI] [PubMed] [Google Scholar]
- 5.Mourant JR, Bigio IJ, Boyer J, Conn RL, Johnson T, Shimada T. Lasers Surg Med. 1995;17:350–357. doi: 10.1002/lsm.1900170403. [DOI] [PubMed] [Google Scholar]
- 6.Mourant JR, Freyer JP, Hielscher AH, Eick AA, Shen D, Johnson TM. Appl Opt. 1998;37:3586–3593. doi: 10.1364/ao.37.003586. [DOI] [PubMed] [Google Scholar]
- 7.Wilson JD, Bigelow CE, Calkins DJ, Foster TH. Biophys J. 2005;88:2929–2938. doi: 10.1529/biophysj.104.054528. [DOI] [PMC free article] [PubMed] [Google Scholar]
- 8.Smith ZJ, Berger AJ. Opt Lett. 2008;33:714–716. doi: 10.1364/ol.33.000714. [DOI] [PubMed] [Google Scholar]
- 9.Tuchin VV. Tissue optics: light scattering methods and instruments for medical diagnosis. Vol. 13 SPIE press; Bellingham: 2007. [Google Scholar]
- 10.Brunsting A, Mullaney PF. Biophys J. 1974;14:439. doi: 10.1016/S0006-3495(74)85925-4. [DOI] [PMC free article] [PubMed] [Google Scholar]
- 11.Sloot P, Hoekstra AG, Figdor CG. Cytometry. 1988;9:636–641. doi: 10.1002/cyto.990090620. [DOI] [PubMed] [Google Scholar]
- 12.Drezek R, Guillaud M, Collier T, Boiko I, Malpica A, Macaulay C, Follen M, Richards-Kortum RR. J Biomed Opt. 2003;8:7–16. doi: 10.1117/1.1528950. [DOI] [PubMed] [Google Scholar]
- 13.Gurjar RS, Backman V, Perelman LT, Georgakoudi I, Badizadegan K, Itzkan I, Dasari RR, Feld MS. Nat Med. 2001;7:1245–1248. doi: 10.1038/nm1101-1245. [DOI] [PubMed] [Google Scholar]
- 14.Pyhtila JW, Chalut KJ, Boyer JD, Keener J, D’Amico T, Gottfried M, Gress F, Wax A. Gastrointest Endosc. 2007;65:487–491. doi: 10.1016/j.gie.2006.10.016. [DOI] [PubMed] [Google Scholar]
- 15.Arifler D, Guillaud M, Carraro A, Malpica A, Follen M, Richards-Kortum RR. J Biomed Opt. 2003;8:484–494. doi: 10.1117/1.1578640. [DOI] [PubMed] [Google Scholar]
- 16.Park Y, Diez-Silva M, Popescu G, Lykotrafitis G, Choi W, Feld MS, Suresh S. Proc Natl Acad Sci USA. 2008;105:13730–13735. doi: 10.1073/pnas.0806100105. [DOI] [PMC free article] [PubMed] [Google Scholar]
- 17.Eldridge WJ, Sheinfeld A, Rinehart MT, Wax A. Opt Lett. 2016;41:352–355. doi: 10.1364/OL.41.000352. [DOI] [PubMed] [Google Scholar]
- 18.Choi W, Fang-Yen C, Badizadegan K, Oh S, Lue N, Dasari RR, Feld MS. Nat Methods. 2007;4:717–719. doi: 10.1038/nmeth1078. [DOI] [PubMed] [Google Scholar]
- 19.Su JW, Hsu WC, Chou CY, Chang CH, Sung KB. J Biophotonics. 2013;6:416–424. doi: 10.1002/jbio.201200022. [DOI] [PubMed] [Google Scholar]
- 20.Schürmann M, Scholze J, Müller P, Guck J, Chan CJ. J Biophotonics. 2016;9:1068–1076. doi: 10.1002/jbio.201500273. [DOI] [PubMed] [Google Scholar]
- 21.Rinehart M, Zhu Y, Wax A. Biomed Opt Express. 2012;3:958–965. doi: 10.1364/BOE.3.000958. [DOI] [PMC free article] [PubMed] [Google Scholar]
- 22.Rinehart MT, Drake TK, Robles FE, Rohan LC, Katz D, Wax A. J Biomed Opt. 2011;16:120510–1205103. doi: 10.1117/1.3665439. [DOI] [PMC free article] [PubMed] [Google Scholar]
- 23.Goldstein RM, Zebker HA, Werner CL. Radio Sci. 1988;23:713–720. [Google Scholar]
- 24.Gass J, Dakoff A, Kim M. Opt Lett. 2003;28:1141–1143. doi: 10.1364/ol.28.001141. [DOI] [PubMed] [Google Scholar]
- 25.Rinehart MT, Shaked NT, Jenness NJ, Clark RL, Wax A. Opt Lett. 2010;35:2612–2614. doi: 10.1364/OL.35.002612. [DOI] [PubMed] [Google Scholar]
- 26.Cheng YY, Wyant JC. Appl Opt. 1984;23:4539–4543. doi: 10.1364/ao.23.004539. [DOI] [PubMed] [Google Scholar]
- 27.Backman V, Wallace MB, Perelman L, Arendt J, Gurjar R, Müller M, Zhang Q, Zonios G, Kline E, McGillican T. Nature. 2000;406:35–36. doi: 10.1038/35017638. [DOI] [PubMed] [Google Scholar]
- 28.Laven P. PhilipLaven.com. 2006;10 [Google Scholar]
- 29.Collier T, Lacy A, Richards-Kortum R, Malpica A, Follen M. Acad Radiol. 2002;9:504–512. doi: 10.1016/s1076-6332(03)80326-4. [DOI] [PubMed] [Google Scholar]
- 30.Ho D, Drake TK, Bentley RC, Valea FA, Wax A. Biomed Opt Express. 2015;6:2755–2765. doi: 10.1364/BOE.6.002755. [DOI] [PMC free article] [PubMed] [Google Scholar]
- 31.Terry NG, Zhu Y, Rinehart MT, Brown WJ, Gebhart SC, Bright S, Carretta E, Ziefle CG, Panjehpour M, Galanko J. Gastroenterol. 2011;140:42–50. doi: 10.1053/j.gastro.2010.09.008. [DOI] [PMC free article] [PubMed] [Google Scholar]
- 32.Brown WJ, Pyhtila JW, Terry NG, Chalut KJ, D’Amico TA, Sporn TA, Obando JV, Wax A. IEEE J Sel Top Quantum Electron. 2008;14:88–97. [Google Scholar]
- 33.Sung KB, Richards-Kortum R, Follen M, Malpica A, Liang C, Descour M. Opt Express. 2003;11:3171–3181. doi: 10.1364/oe.11.003171. [DOI] [PubMed] [Google Scholar]
- 34.van de Hulst HC. Light scattering by small particles. Courier Corporation; 1957. [Google Scholar]
- 35.Ho D, Kim S, Drake TK, Eldridge WJ, Wax A. Biomed Opt Express. 2014;5:3292–3304. doi: 10.1364/BOE.5.003292. [DOI] [PMC free article] [PubMed] [Google Scholar]
Associated Data
This section collects any data citations, data availability statements, or supplementary materials included in this article.


