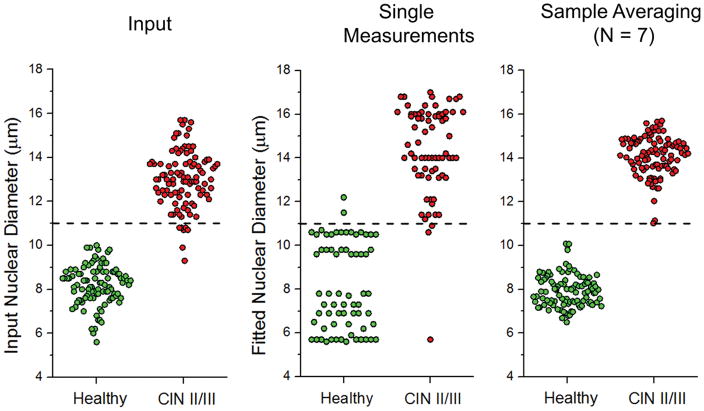
Figure 4.
(Left) Distribution of mean nuclear diameters for simulated healthy and dysplastic cervical tissues, N=100 each. CIN II/III represents expected nuclear morphology for a high-grade squamous intraepithelial lesion (HSIL). (Middle) Individual size measurements of the input diameters on the left using the m > 1 library. (Right) Sample averaging of N=7 improves diagnostic accuracy. The measured healthy distribution is indistinguishable from the input, p > 0.1. The dysplastic population is systematically shifted upwards by 1 μm, but indistinguishable from the input (p > 0.5) when this is corrected. A suggested decision line at 11 μm is included for illustrative purposes.

