
Figure 4. TRIR of the Wild-type PixD Light State.
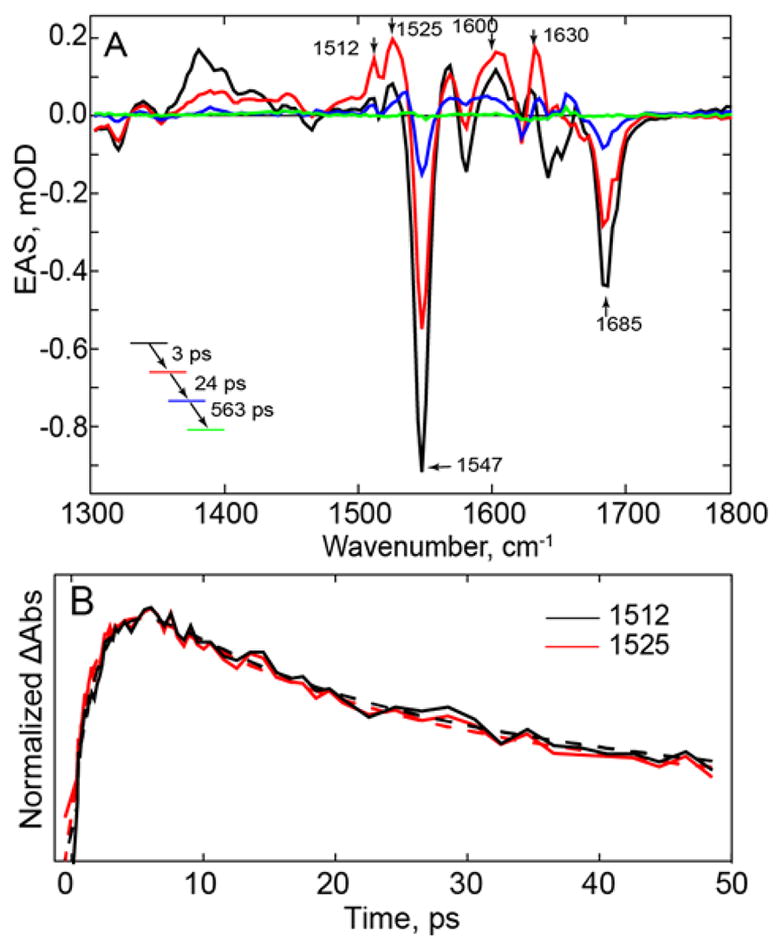
(A) EAS of light adapted PixD generated by constant illumination with 450 nm light focused on the sample in the TRIR experiment. (B) Comparison of the kinetics of the bands at 1512, 1525, cm−1. Raw data are shown as solid lines while global fitting results are shown as dashed lines.