
Fig. 9.
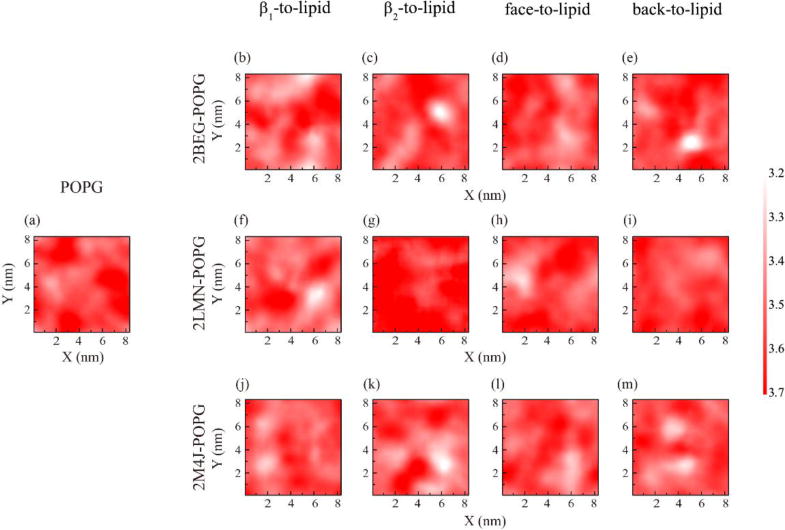
The POPG bilayer thickness distribution map over the x-y plane for each Aβ-POPG system in the MD runs starting from different initial states: β1-to-lipid, β2-to-lipid, face-to-lipid and back-to-lipid. For comparison, the bilayer thickness distribution map of a pure POPG bilayer is also presented. The bilayer thickness was calculated using the last 50-ns data of each MD run.