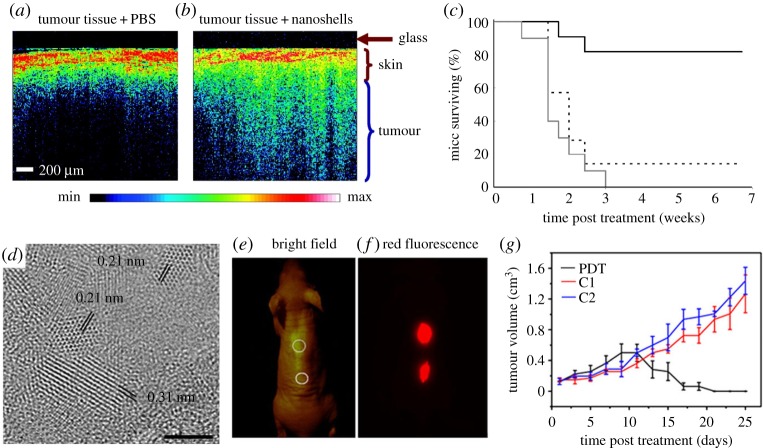
Figure 6.
Optical coherence tomography (OCT) images from tumours of mice intravenously administered with phosphate buffered saline (PBS) (a) or gold nanoshells (b). (c) Survival data from the treated groups of gold nanoshell + NIR irradiation (solid black line), PBS sham + NIR laser treatment (dashed black line), untreated control (grey line). (d) High-resolution TEM image of graphene quantum dots (GQDs). Scale bar, 2 nm. (e,f) Bright-field image (e) and red-fluorescence image (f) after subcutaneous injection of GQDs in different areas (ex/em = 502–540/695–775). (g) Time-dependent tumour growth curves (n = 5) after PDT treatment compared with control groups (C1, not irradiated group; C2, not GQD-administered group). Reproduced with permission from [85] and [92].

