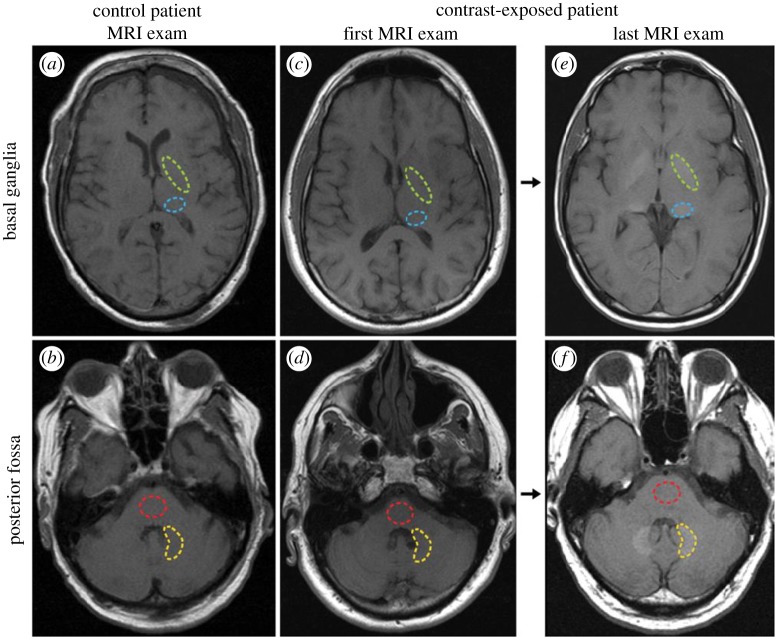
Figure 3.
Axial T1-weighted MR images through the (a,c,e) basal ganglia and (b,d,f) posterior fossa at the level of the dentate nucleus. Images are shown for (a,b) control group patient 4, and the (c,d) first and (e,f) last examinations performed in contrast group patient 13. Regions of interest used in the quantification of signal intensity are shown as dashed lines for the globus pallidus (green, upper region), thalamus (blue, lower region), dentate nucleus (yellow, lower region) and pons (red, upper region). Adapted from [4]. (Online version in colour.)

