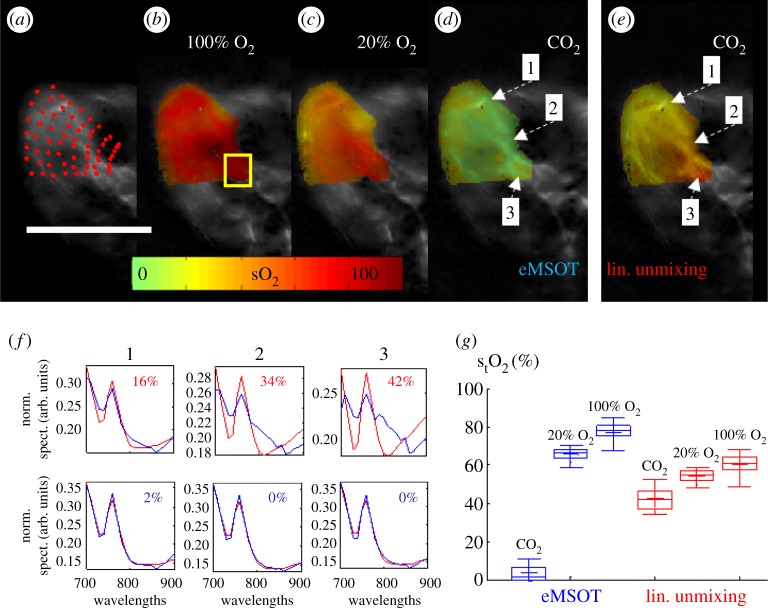
Figure 2.
Comparison of spectral analysis methods for the estimation of blood sO2 in experimental MSOT images of an animal obtained in vivo and post-mortem. (a–d) eMSOT grid applied on the area of the hindlimb muscle (a) and eMSOT tissue blood sO2 estimation in the case of 100% O2 breathing (b), 20% O2 breathing (c) and post-mortem after CO2 breathing (d). (e) sO2 estimation using linear unmixing in the post-mortem case after CO2 breathing. (f) Normalized spectra, spectral fitting and sO2 values of linear unmixing (upper row) and eMSOT (lower row) for the three points indicated in (d) and (e). (g) Estimated blood sO2 of a deep tissue area (yellow box in b) using eMSOT (blue) and linear unmixing (red) under different breathing conditions of CO2, 20% O2 and 100% O2. Image reproduced with permission from [5].

