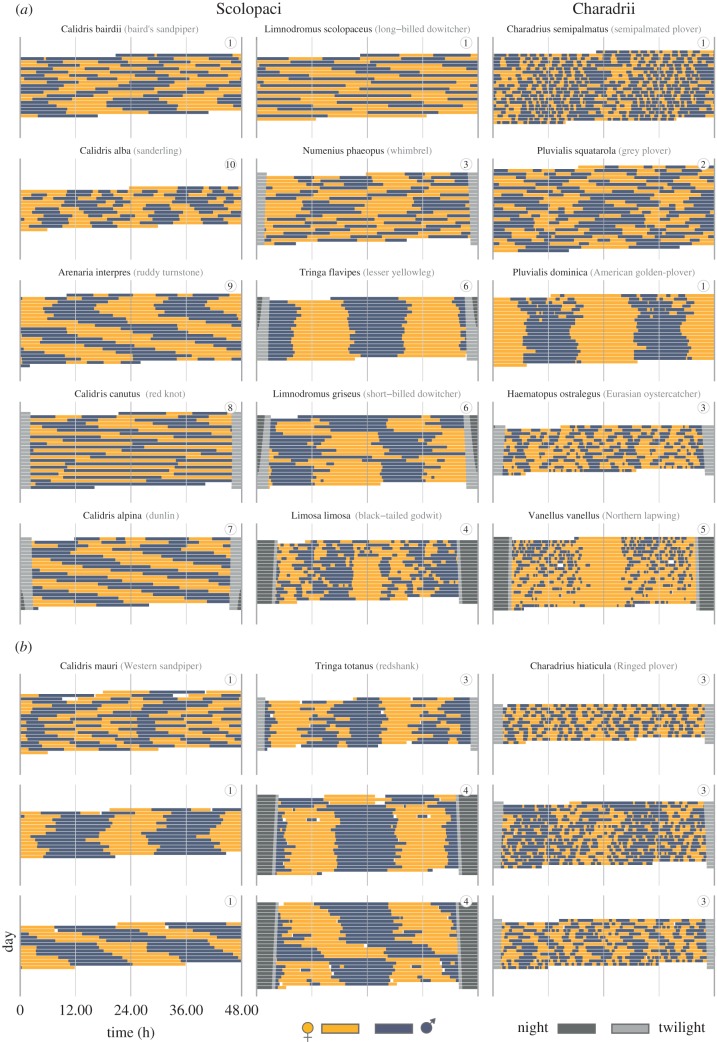
Figure 1.
Actograms illustrating the diversity of shorebird incubation rhythms. (a,b) Each actogram depicts the bouts of female (yellow) and male (blue-grey) incubation at a single nest over a 24-h period, plotted twice, such that each row represents two consecutive days. If present, twilight is indicated by light grey bars and corresponds to the time when the sun is between 6° and 0° below the horizon, night is indicated by dark grey bars and corresponds to the time when the sun is more than 6° below the horizon. Twilight and night are omitted in the centre of the actogram (24.00) to make the incubation rhythm visible. The circled numbers indicate the breeding site of each pair (i.e. highlight which pairs bred in the same breeding site). (a) Between-species diversity. (b) Within-species diversity. Note that the three rhythms for western sandpiper and ringed plover come from the same breeding location. The actograms for each nest in the study together with the data and code to replicate the figure are freely available at https://osf.io/wxufm/ [46]. Adapted from [12].

