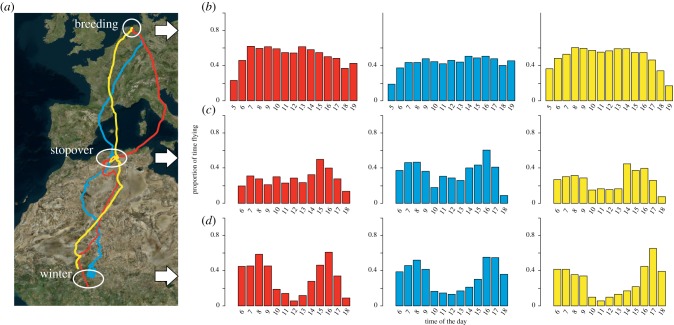
Figure 2.
Example of daily foraging rhythms in three Montagu's Harriers. (a) Map presents migration tracks and corresponding bar plots represent proportion of time a bird spent flying during each hour of the day (GMT; averaged across 7–14 days) at the wintering site (d), main spring migratory stopover site (c) and breeding site (b). Note that only daylight hours are included as Montagu's Harriers are strictly diurnal and loggers recorded the necessary detailed information (5–30 min sampling interval) only during the day. The three harriers are distinguished by colour (#428 - depicted in red, #810 - blue, #515 - yellow, which belong to the dataset published in https://datadryad.org/resource/doi:10.5061/dryad.84jk0).

