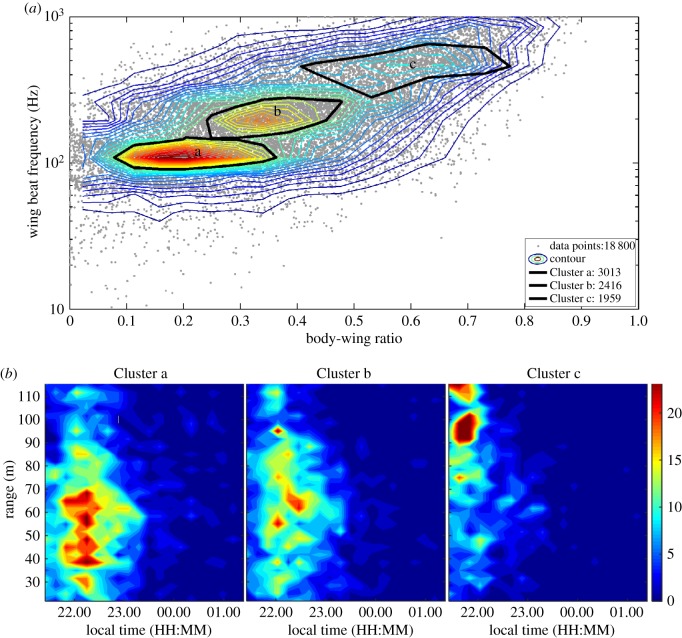
Figure 3.
Using lidar to classify insect groups and their temporal and spatial distribution. (a) Contour plot illustrates insect densities based on body-wing ratio and the wing beat frequency as recorded by lidar. The three major insect clusters are indicated by black curves and as verified by insect traps represent mostly Trichoptera and Chironomidae (Cluster a), swarming non-biting midges and flies (Cluster b), and compact insects (Cluster c). The number assigned to each cluster in the legend represents the number of points in that cluster [34]. (b) Heat maps with temporal and spatial distribution of the three insect clusters. Note that the 140 m long transect (range) started in an open meadow and terminated in a meadow surrounded by a forest edge. (a,b) Red denotes areas with a high density of insects, whereas blue denotes low insect densities. Reproduced with permission from [34].

