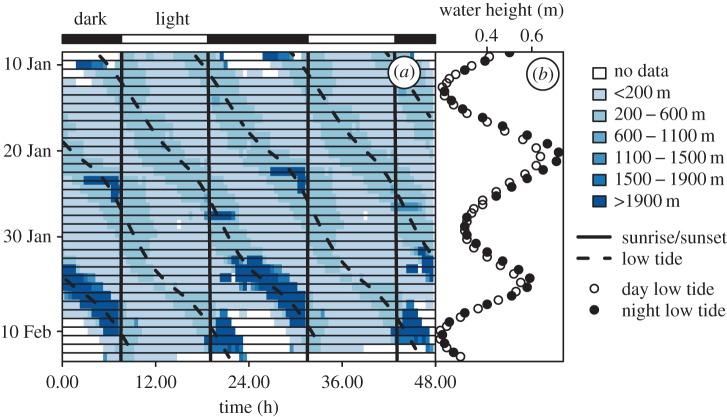
Figure 3.
The distance of a radio-tagged red knot to its roost. (a) The distance to the main roost (the darker the blue, the farther the knot travelled). Sunrise and sunset are given by the solid vertical lines and the day and night are indicated above the actogram. The low tide times are given by the dashed lines. For actograms see [16]. (b) Differences in low-tide water height between day (open circles) and night (filled circles) and during the neap–spring lunar cycle.

