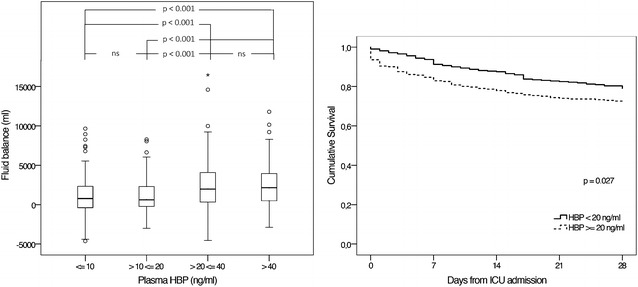
Fig. 2.

Fluid balance and 28-day survival. The left boxplot describes patients’ fluid balance within 24 h from ICU admission separated by plasma HBP quartiles and includes testing for significant difference between plasma HBP levels of each individual group (n = 601, ns: not significant). The right Kaplan–Meier survival curve pictures survival within 28 days from ICU admission among patients with a high versus low plasma HBP on ICU admission (n = 601)
