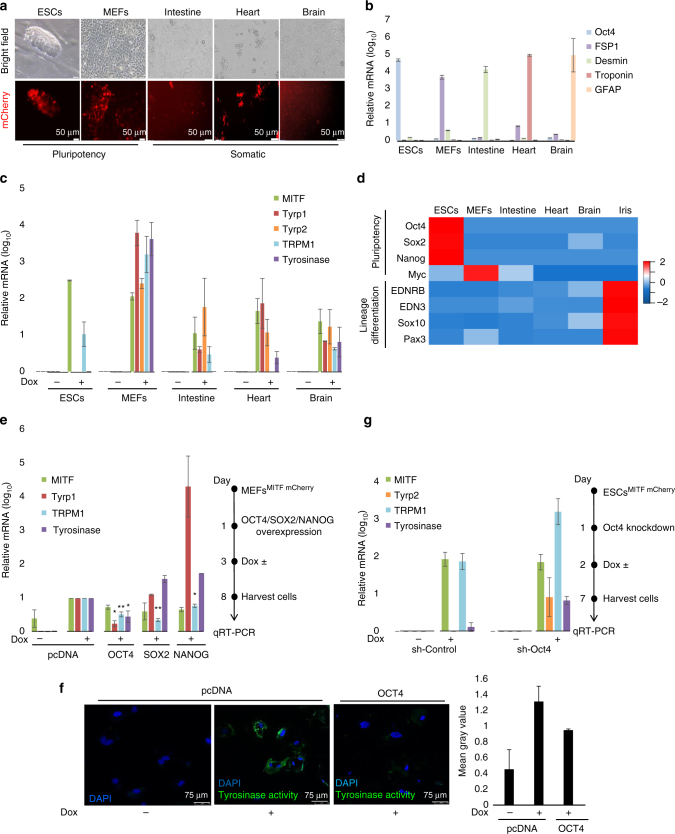
Fig. 3.
OCT4 impedes mESCs differentiation despite MITF expression. a Representative microscopy images of mESCs, MEFs, and cells from the intestine, heart, and brain from Mitf knock-in chimera mice. This was one of n = 3 experiments. b Expression of lineage specific markers in the investigated cell types are shown. Levels were normalized to Gapdh. Error bars represent ± SEM (n = 3). c Mitf, Tyrp1, Tyrp2, Trpm1, and Tyrosinase mRNA levels in the indicated cells at day 6 post Dox induction and in vehicle-treated cells. Relative levels were normalized to Gapdh. Error bars represent ± SEM (n = 3). d Gene expression profile of the investigated cells. e MEFs were transfected with expression plasmids or transduced with retroviruses for expression of OCT4, SOX2, or NANOG. Mitf, Tyrp1, Trpm1, and Tyrosinase mRNA levels were evaluated at day 6 post Dox induction. Levels were normalized to Gapdh. Fold changes relative to control cells transfected with empty vector (pcDNA) and treated with Dox are shown. Error bars represent ± SEM. * indicates p < 0.05, ** indicates p < 0.01 (n = 3). Experiment process is shown schematically to the right. f MEFs were transfected with a plasmid for expression of OCT4 or empty vector control (pcDNA). Tyrosinase activity (Cy5, green) was evaluated at day 6 post Dox induction. Nuclei appear blue (DAPI). Green pixel quantification for 10 nuclei from each treatment using ImageJ software is plotted to the right. This was one of n = 2 experiments. g mESCs were transduced with lentiviral vectors for expression of shRNA targeting Oct4 or empty vector as control (sh-control). Mitf, Tyrp2, Trpm1, and Tyrosinase mRNA levels were evaluated at day 6 post Dox induction. Levels were normalized to Gapdh, and fold changes relative to control are shown. Error bars represent ± SEM (n = 2). Experiment process is presented schematically on the right

