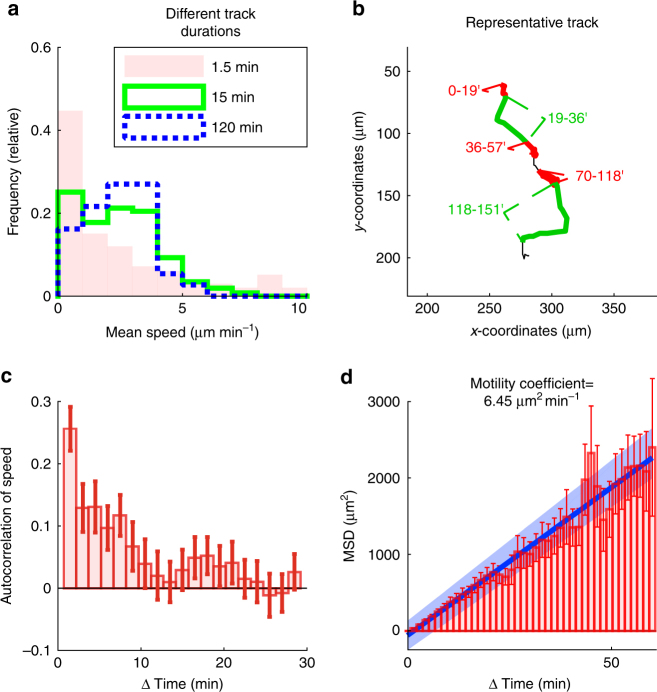
Fig. 2.
Lung infiltrating T cells move over a wide range of speeds. GFP+ effector T cells were injected i.v. into LPS-treated mice. After two to five days, lungs were explanted and imaged with two-photon microscopy. Tracks with a duration of 120 min were analyzed. a Shown are the average speeds of complete 120 min ‘‘parent’’ tracks (n = 37 tracks), and of 15 min (n = 259 tracks) and 1.5 min (n = 2923 tracks) track ‘‘children’’. b Representative T cell track with multiple transitions between ‘‘fast’’ (green segments) and ‘‘slow’’ migration (red segments). Numbers indicate time in minutes. c Autocorrelation of speeds. Means of 37 tracks (+/− standard error of the mean). d The mean squared displacements (MSD) of 37 tracks (+/− standard error of the mean). The blue line and shaded area show the linear regression with confidence interval. All quantitative analyses were performed on pooled data obtained from three independent experiments

