Fig. 4.
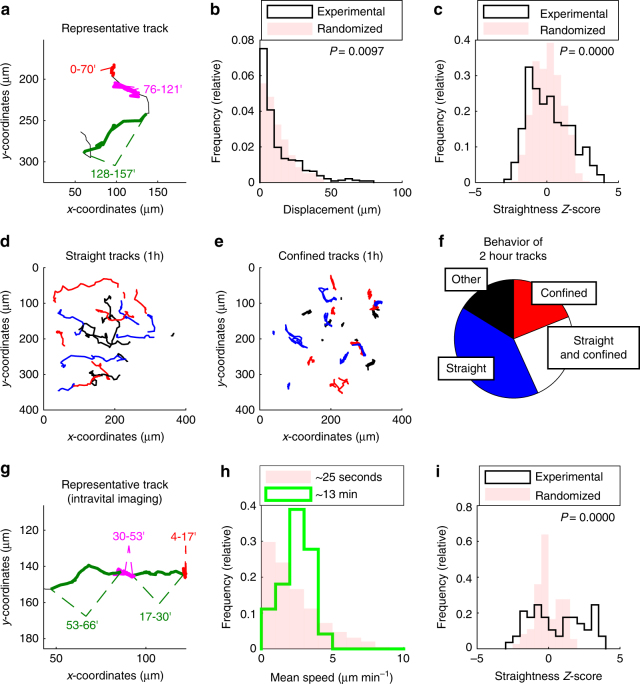
Lung-infiltrating T cells switch between straight and confined migration. GFP+ effector T cells were injected i.v. into LPS-treated mice. After two to five days, lungs were explanted (a–f) and imaged with two-photon microscopy or imaged using intravital microscopy (g–i). a Representative track displaying straight (green) and confined (red and magenta) migration. Numbers indicate time in minutes. b, c Analysis of displacement (b) and straightness Z-score (c) of 15 min tracks (n = 477 tracks). P-values were computed with the Kolmogorov–Smirnov test. d, e Analysis of 1 h tracks (n = 94 tracks). Depiction of ‘‘straight’’ (d; straightness Z-score > 1.7) and ‘‘confined’’ tracks (e; straightness Z-score < −0.9). f Two hour tracks (n = 37) were analyzed for switching between confinement and straight migration. Quantitative analyses from a–f were performed on pooled data obtained from three independent experiments. g–i GFP+ effector T cells were injected i.v. into LPS-treated mice. After two to five days, lungs were imaged with intravital two-photon microscopy. g Representative track displaying straight (green) and confined (red and magenta) migration. Numbers indicate time in minutes. h Shown are histograms of the mean speeds of 13 min (n = 154 tracks; median speed: 2.4 µm min−1) and 25 s (n = 5194 tracks) tracks. i Analysis of straightness Z-score (track duration approximately 13 min) before and after randomization of velocity vectors (n = 154 tracks). P-value was computed with the Kolmogorov–Smirnov test. A total of three movies obtained from different mice were analyzed in g–i

