Fig. 5.
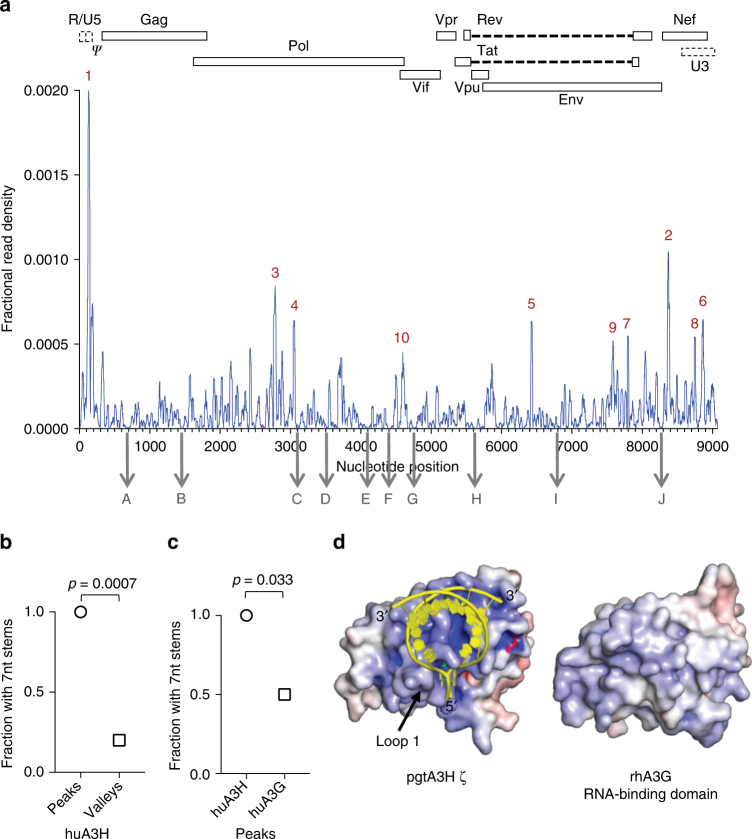
Analysis of A3H binding to the HIV-1 genome. a Frequency distribution of nucleotide occurrence (read density) relative to the sum of read densities in reads mapped to the HIV-1 NL4-3 genome in a huA3H CLIP-Seq experiment using HIV-1 particles8. The 10 most frequently (designated 1–10 for highest to lowest fractional read density) and 10 least frequently bound sites (designated A–J for relative position in the viral genome) are indicated. A schematic diagram of the HIV-1 genome is shown above. b Frequency with which ≥7-nt duplexes are predicted to occur within 101-nt RNA elements containing the 10 sites with high-frequency binding (peaks 1–10), and 101-nt elements with low-frequency binding (valleys A–J). c Frequency with which ≥7-nt duplexes are predicted to occur within 101-nt RNA elements containing the 10 sites most frequently bound by A3H and A3G. d Comparison of surface charge distribution for A3H and the A3G RNA-binding domain. RNA (yellow cartoon) binds to the most positively charged surface of A3H (electrostatic surface potential colored from red to blue, −10 to +10 kT/e). The analogous surface of the A3G RNA-binding domain (PDB 5K8122) is relatively hydrophobic

