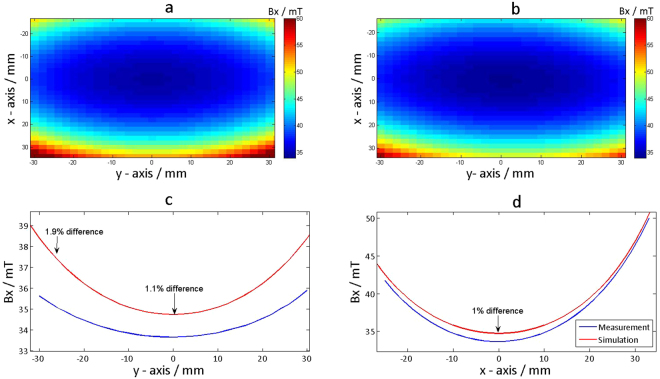
Figure 7.
Magnetic flux density mapping results of a Halbach ring magnet compared with simulation results. (a) Measurement results of a 60 × 60 mm2 slice with the centre of the ring being the isocenter, the spatial mapping resolution was 2 mm. (b) Simulation results with the same setup. (c) Comparison of the line plots through the isocenter between the measurement and simulation on the y-axis. A maximum deviation of 1.9% was observed. (d) Comparison between of the line plots through the isocenter the measurement and simulation on the x-axis. A maximum deviation of 1% was observed.

