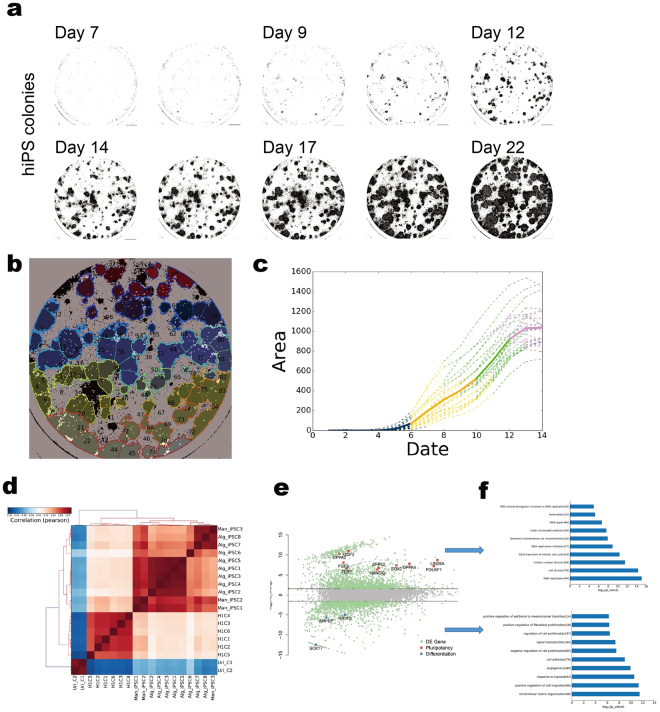
Figure 3.
Quantitative detection in synchronized time-lapse data for iPSCs selection prediction in human somatic cellular reprogramming. (a) A series detection map for the entire reprogramming process from day 7 to day 22. Binary indication masked out the colonies by classifier. (b) A segmented map. An example result of segmentation on a detection map, each segment represents a single colony (left); each colonies was individually registered for further process(right). (c) Growth curve of selected colony. Different colour indicted for different phases, which was calculated by the mathematical model; the purple colour stands for the mature phase. Solid line is an average of all training data and dash lines are some examples of training data. (d) Hierarchic clustering analysis of global gene expression based on Pearson correlation for Alg_iPSCs, H1 (C1–6) and Uri_C(1–2). (e) Differential gene expression profile between Alg_iPSCs (above) and UCs (below). The differentially expressed genes (red) are those with an adjusted P value 0.05 and fold change 3. (f) Functional annotations of genes differentially expressed between Alg_iPSCs (top) and UCs (bottom). Gene ontology (GO) was performed by DAVID, and enriched GO terms (biological processes) for each cell type are plotted with −log 10 of the adjusted P values.

